Demography of enterprises
Despite the pandemic, number of companies in the market remains positive in 2020


October 26, 2022 10h00 AM | Last Updated: October 27, 2022 11h45 PM
Highlights
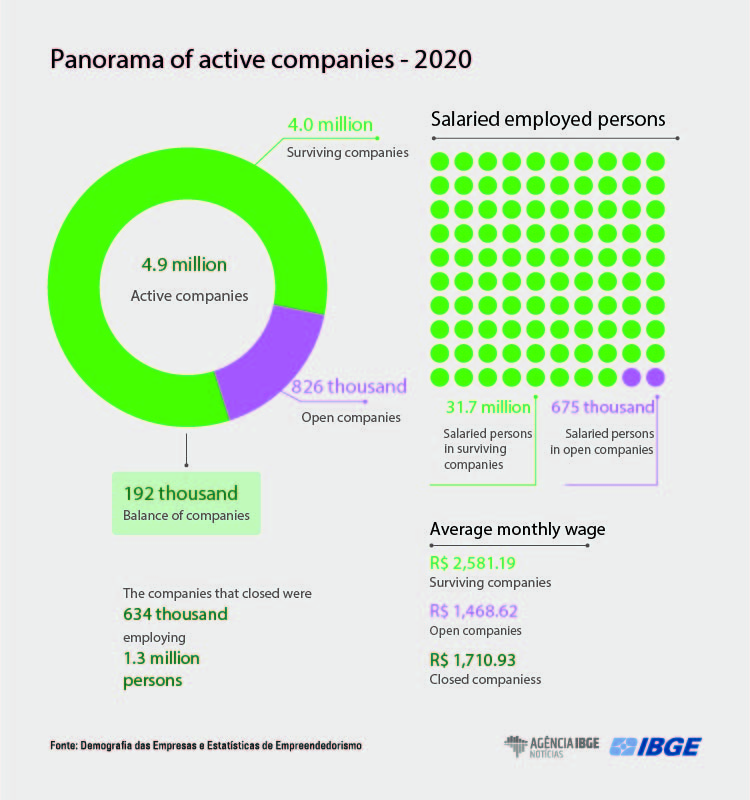
- In 2020, 826,4 thousand companies entered the market and 634,4 thousand exited the market, which resulted in 192,0 thousand companies left.
- The entry rate of enterprises was 16.9% and exit rate, 13.0%. In 2019, the figures were 20.2% and 14%, respectively.
- The balance of salaried workers in entering companies in 2020 was positive (204,9 thousand persons), but lower than in 2019 (595,5 thousand persons).
- The proportion of salaried women in companies exiting the market (44.1%) surpassed that in entering ones (40.5%).
- The average age of companies was 11.6 year in 2020, the same as in 2018 and virtually the same as in 2019 (11.7 years).
- The number of high-growth companies fell by 2.6% in 2020, after two consecutive years of increase.
- In 2020, the country had 2,768 “gazelle”, high-growth enterprises up to 5 years of age. That was similar to the figure in 2019 (2,805).

The balance between companies entering and exiting the market remined positive in 2020: 192,0 thousand. In spite of the pandemic, that was the second year with a positive balance, since 2018 (a reduction by 65,9 thousand enterprises). The survival rate (percentage of active companies in 2019 still existing in 2020) was 83.1%.
In 2020, according to the IBGE’s Central Registry of Enterprises (Cempre), the country had 4.9 million active companies employing 39.4 million persons, being 32.4 million (82.3%) salaried ones and 7.0 million (17.7%) partners or owners. Salaries and other compensation amounted to R$1,1 trillion, with an average monthly salary of R$2,568.48. The average age of the companies amounted to 11.6 years, the same as in 2018 and almost the same as in 2019 (11.7 years).
The data was obtained from the study “Demography of Enterprises and Statistics of Entrepreneurship”, released today by the IBGE.
Effects of the pandemic have not been fully observed
The entry rate fell from 20.2% in 2019 to 16.9% in 2020 and the exit rate, from 14.0% to 13.0%. The manager of the survey, Thiego Gonçalves Ferreira, reduction of the entry rate would be an expected effect, but not in the exit rate, which recorded its lowest result since 2008. Nevertheless, the phenomenon was observed in other countries: eight of the 12 nations analyzed reported a decrease in exit from the market.
“Maybe it will take us a little longer to detect all the effects of the pandemic. Some public policies added to company survival, such as the National Support Program for Micro and Small Enterprises (Pronampe). Also, the initial shock caused by COVID-19 was observed in the country from March on. The companies that worked up to that moment, although, even when they ended their activities in the following months, are not part of the exit statistics, due to a methodological question based on international manuals,” Mr. Ferreira highlights.
He explains that the data are surprising and must be considered with caution, especially in comparison with previous years, because the methodology of the survey went through a change in methodology defines active organizations, due to a new registration system adopted by the federal government.
| Companies and salaries employed persons and respective rates, by type of demographic event - Brazil - 2008-2020 | ||||||
|---|---|---|---|---|---|---|
| Year | Types of demographic events | |||||
| Active companies | Exits | Balance (Entries-Exits) |
||||
| Total | Entries | |||||
| Total | Rates (%) | Total | Rates (%) | |||
| Companies | ||||||
| 2008 | 4 077 662 | 889 486 | 21.8 | 719 915 | 17.7 | 169 571 |
| 2009 | 4 268 930 | 946 676 | 22.2 | 755 154 | 17.7 | 191 522 |
| 2010 | 4 530 583 | 999 123 | 22.1 | 736 428 | 16.3 | 262 695 |
| 2011 | 4 538 347 | 871 804 | 19.2 | 864 035 | 19.0 | 7 769 |
| 2012 | 4 598 919 | 859 992 | 18.7 | 799 419 | 17.4 | 60 573 |
| 2013 | 4 775 098 | 871 663 | 18.3 | 695 748 | 14.6 | 175 915 |
| 2014 | 4 557 411 | 726 271 | 15.9 | 943 958 | 20.7 | (-) 217 687 |
| 2015 | 4 552 431 | 708 644 | 15.6 | 713 628 | 15.7 | (-) 4 984 |
| 2016 | 4 481 596 | 648 474 | 14.5 | 719 551 | 16.1 | (-) 71 077 |
| 2017 | 4 458 678 | 676 444 | 15.2 | 699 376 | 15.7 | (-) 22 932 |
| 2018 | 4 392 871 | 697 079 | 15.9 | 762 940 | 17.4 | (-) 65 861 |
| 2019 | 4 683 840 | 947 311 | 20.2 | 656 372 | 14.0 | 290 939 |
| 2020 | 4 875 827 | 826 404 | 16.9 | 634 439 | 13.0 | 191 965 |
| Salaried employed persons | ||||||
| 2008 | 26 978 086 | 817 854 | 3.0 | 414 908 | 1.5 | 402 946 |
| 2009 | 28 238 708 | 865 133 | 3.1 | 452 208 | 1.6 | 412 925 |
| 2010 | 30 821 123 | 1 023 753 | 3.3 | 363 848 | 1.2 | 659 905 |
| 2011 | 32 706 200 | 980 131 | 3.0 | 410 407 | 1.3 | 569 724 |
| 2012 | 33 915 323 | 950 476 | 2.8 | 453 082 | 1.3 | 497 394 |
| 2013 | 35 050 524 | 887 694 | 2.5 | 524 159 | 1.5 | 363 535 |
| 2014 | 35 220 894 | 847 114 | 2.4 | 525 652 | 1.5 | 321 462 |
| 2015 | 33 623 393 | 777 826 | 2.3 | 492 182 | 1.5 | 285 644 |
| 2016 | 32 011 930 | 739 332 | 2.3 | 507 051 | 1.6 | 232 281 |
| 2017 | 31 877 046 | 829 406 | 2.6 | 469 406 | 1.5 | 360 000 |
| 2018 | 32 296 827 | 863 255 | 2.7 | 512 113 | 1.6 | 351 142 |
| 2019 | 33 071 591 | 1 034 462 | 3.1 | 438 917 | 1.3 | 595 545 |
| 2020 | 32 411 917 | 675 299 | 2.1 | 470 366 | 1.5 | 204 933 |
| Source: IBGE, Diretoria de Pesquisas, Coordenação de Cadastro e Classificações, Cadastro Central de Empresas 2005-2020. Note: The calculation of salaried employed persons in the year t is not necessarily equivalent to the number of salaried employed persons in the year t-1, plus the balance of entries and exits of the year t, due to changes of salaried persons of surviving companies. Likewise, active companies cannot be calculated with the balance of entries and exits, due, among other reasons, to the reclassification of companies. For firther information, see the section on Technical Notes. |
||||||
Surviving companies employed 97.9% of the salaried persons
Unlike Cempre (35.3 million companies), Demography of Enterprises considers only active companies that are legal persons as business entities, not including public administration bodies, non-profit organizations and international organizations working in the country. It is worthy of mention that Individual Micro Entrepreneurs (MEIs) are not included in the survey either.
Among the 4.9 million active companies, 4.0 million have survived, that is, they were already active in 2019, which represents a survival rate of 83.1%. A total of 826 thousand companies (16.9%), with most having been born (670 thousand) and 157 thousand reentering the market. Companies exiting the market amounted to 13.0% (634 thousand companies), lowest rate since the start of the time series, in 2008.
Among the 39.4 million employed persons in active companies, almost 96% are in surviving companies. They pay, on the average, R$ 2,581 against R$ 1,469 paid by companies entering the market.
Mr. Ferreira highlights that, in general, surviving companies are bigger sized, besides accounting for most of the Jobs and paying higher salaries, which possibly helps attract more professionals with a higher education degree.
“Surviving companies stood out in terms of salaried persons (97.9%), salaries and other compensation (99.3%), monthly wages and for having 14.7% of its workforce with a higher education degree. Companies entering the market had a participation of 2.1% in salaried persons and 7.6% of higher education, whereas companies exiting the market employed 1.5% of the salaried persons and 8.2% of those with a higher level of schooling.”
There was a predominance of smaller companies in relation to entry and exit. About 78.7% of the companies entering the market in 2020 did not have salaried employed persons, only partners or owners, and 19.9% employed 1 to 9 salaried persons. Likewise, as for exit from the market, 79.9% of the companies had no salaried persons, and 18.8%, had 1 to 9 of those.
Companies that were closed had the biggest proportion of salaried women
In the total active companies in 2020, 38.8% of the workforce was female. Nevertheless, when analyzed by demographic event, the entering companies employed 40.5% of the salaried women and exiting companies employed an even bigger percentage, 44.1%, being the highest in the time series, “Two sectors that employ mostly women and that were affected during the pandemic have contributed to this result: Lodging and feeding and Education.”
Trade leads positive balance of companies, but loses employed persons
The most relevant sector in the positive balance of 192 thousand companies was Trade, repair of motor vehicles and of motorcycles, with 39 thousand, followed by Professional, administrative, scientific and technical activities (35 mil) and Human health and social services (27 thousand).
“Despite the positive balance of entries and exits, trade was one of the sectors losing most employed persons against the previous year: a drop by 222 thousand, only second to lodging and feeding, which lost 373 thousand persons,” Mr. Ferreira highlights.
Another highlight, according to the manager of the survey, was “the importance of size in the survival rate in the long ter. Among companies without employed persons and that were born in 2015, only 35.5% survived after five years. Among companies with ten or more employed persons born in the same year, the rate almost doubled, 67.5%”.
The survey also shows details of the migration between sizes in the case of surviving companies. Those who remained in the same range of salaried persons amounted to 88.6%. Only 4.5% reached a higher level, the lowest figure in the series, as well as the rate of companies that reduced their number of employees, 7%. “Since fewer companies changed levels, that indicates a net effect of -2.5%, the second biggest drop in the series,” Mr. Ferreira highlights.
Expansion of new local branches decelerated during the pandemic
In 2019, about 9.0% of the entering local branches came from companies that were already in the market, a rate that fell to 6.3% in 2020. “The companies that were already in the market were cautious during the pandemic,” says the manager.
Among the Federation Units, Santa Catarina stands out, with a survival rate of 27.6% of the local branches born in 2010. On the other extreme, Acre had the lowest survival rate (13.2%). “Agap of 14.4 percentage points separates the highest from the lowest rate,” says Mr. Ferreira.
| Local branches and survival rates of local branches born in 2010, by years of observation, by Major Regions and Federation Units - 2010-2020 | |||||||||||
|---|---|---|---|---|---|---|---|---|---|---|---|
| Major Regions and Federation Units |
Local branches born in 2010 | Survival rate, by years of observation | |||||||||
| 1st year 2011 (%) |
2nd year 2012 (%) |
3rd year 2013 (%) |
4th year 2014 (%) |
5th year 2015 (%) |
6th year 2016 (%) |
7th year 2017 (%) |
8th year 2018 (%) |
9th year 2019 (%) |
10th year 2020 (%) |
||
| Brazil | 797 993 | 75.4 | 63.3 | 54.2 | 44.9 | 39.3 | 34.4 | 30.4 | 26.6 | 23.9 | 21.3 |
| North | 36 409 | 67.9 | 56.1 | 46.6 | 37.0 | 32.0 | 27.7 | 24.3 | 21.3 | 19.0 | 16.8 |
| Rondônia | 6 259 | 70.4 | 58.7 | 50.1 | 40.6 | 35.0 | 31.0 | 27.2 | 24.2 | 21.6 | 19.0 |
| Acre | 2 263 | 53.4 | 42.5 | 34.5 | 26.2 | 22.5 | 20.1 | 17.9 | 15.9 | 14.4 | 12.9 |
| Amazonas | 7 489 | 62.3 | 50.5 | 40.9 | 30.5 | 26.2 | 22.1 | 19.3 | 16.6 | 14.8 | 13.3 |
| Roraima | 1 122 | 63.4 | 54.1 | 46.4 | 36.2 | 31.6 | 28.4 | 25.2 | 22.1 | 20.6 | 18.0 |
| Pará | 12 833 | 71.1 | 59.6 | 49.4 | 39.9 | 34.5 | 29.7 | 26.0 | 22.7 | 20.0 | 17.8 |
| Amapá | 2 072 | 67.3 | 52.0 | 41.7 | 33.5 | 28.8 | 24.5 | 21.1 | 18.4 | 16.0 | 13.7 |
| Tocantins | 4 371 | 73.1 | 61.6 | 51.5 | 42.3 | 36.,8 | 32.1 | 28.2 | 24.7 | 22.2 | 19.7 |
| Northeast | 135 289 | 74.1 | 61.9 | 52.4 | 42.2 | 37.0 | 32.4 | 28.5 | 24.7 | 21.8 | 19,1 |
| Maranhão | 12 046 | 73.6 | 62,0 | 51.7 | 40.4 | 35.2 | 30.5 | 26.9 | 23.3 | 20.3 | 17.7 |
| Piauí | 6 338 | 78.9 | 68.3 | 58.8 | 49.3 | 44.0 | 39.3 | 35.8 | 32.0 | 29.1 | 25,4 |
| Ceará | 23 817 | 73.5 | 61.3 | 52.2 | 41.3 | 36.0 | 31.5 | 27.3 | 23.7 | 20.8 | 18.2 |
| Rio Grande do Norte | 9 777 | 76.2 | 63.4 | 53.5 | 43.6 | 38.5 | 33,9 | 29.5 | 25.4 | 22.3 | 19.4 |
| Paraíba | 8 485 | 75.1 | 61.8 | 53.0 | 42.8 | 38.6 | 34.2 | 30.3 | 26.9 | 23,9 | 21,5 |
| Pernambuco | 23 321 | 74.1 | 61.6 | 52.3 | 42.1 | 36.6 | 31.8 | 27.5 | 24.0 | 21.1 | 18.4 |
| Alagoas | 6 448 | 75.0 | 64.0 | 53.6 | 44.7 | 38.4 | 33.6 | 28.8 | 24.8 | 21,3 | 18.7 |
| Sergipe | 4 296 | 79.0 | 67.2 | 57.7 | 49.1 | 44.1 | 39.2 | 34.5 | 30.2 | 27.5 | 24.7 |
| Bahia | 40 761 | 72.4 | 60.0 | 50.7 | 40.7 | 35.7 | 31.3 | 27.7 | 23.9 | 20.9 | 18.3 |
| Southeast | 393 614 | 76.3 | 64.0 | 54.9 | 45.7 | 39.8 | 34.6 | 30.5 | 26.8 | 24.1 | 21,4 |
| Minas Gerais | 84 287 | 76.8 | 64.0 | 54.9 | 45.1 | 39.5 | 34.8 | 31.0 | 27.3 | 24.6 | 21.8 |
| Espírito Santo | 15 079 | 75.1 | 63.4 | 55.2 | 46.0 | 40.7 | 36.0 | 31.9 | 28.1 | 25.3 | 22.4 |
| Rio de Janeiro | 59 936 | 73.3 | 61.5 | 53.0 | 44.5 | 39.4 | 34.8 | 30.6 | 26.8 | 24.1 | 21.1 |
| São Paulo | 234 312 | 77.0 | 64.7 | 55.5 | 46.3 | 40.0 | 34.3 | 30.1 | 26.5 | 23.9 | 21.3 |
| South | 165 423 | 75.5 | 63.7 | 55.1 | 46.6 | 41.3 | 36.8 | 32.8 | 29.1 | 26.6 | 23.9 |
| Paraná | 64 633 | 76.4 | 64.8 | 56.3 | 47.6 | 42.3 | 37.5 | 33.4 | 29.4 | 26.6 | 23.8 |
| Santa Catarina | 37 085 | 76.6 | 65.6 | 57.6 | 50.1 | 44.6 | 40.1 | 36.3 | 32.7 | 30.1 | 27.6 |
| Rio Grande do Sul | 63 705 | 74.0 | 61.5 | 52.5 | 43.4 | 38.2 | 34.0 | 30.3 | 26.8 | 24.5 | 22.0 |
| Central-West | 67 258 | 76.6 | 64.4 | 55.1 | 45.9 | 39.9 | 35.1 | 30.7 | 26.3 | 23.6 | 20.9 |
| Mato Grosso do Sul | 9 907 | 76.6 | 64.2 | 56.0 | 47.0 | 42.0 | 37.6 | 33.6 | 29.1 | 26.2 | 23.5 |
| Mato Grosso | 15 102 | 74.7 | 63.4 | 54.4 | 45.5 | 39.8 | 35.4 | 31.0 | 26.4 | 23.8 | 21.2 |
| Goiás | 27 628 | 76.6 | 64.0 | 54.4 | 45.1 | 39.3 | 34.6 | 30.3 | 26.3 | 23.5 | 20.7 |
| Distrito Federal | 14 621 | 78.5 | 66.3 | 56.4 | 47.0 | 39.7 | 33.9 | 29.0 | 24.5 | 21.8 | 19.1 |
| Source: IBGE, Diretoria de Pesquisas, Coordenação de Cadastros e Classificações, Cadastro Central de Empresas 2007-2020. Note: The darkest colors indicate a higher survival rate. |
|||||||||||
After two years recording increase, number of high-growth companies decreases in 2020
The number of high-growth companies dropped 2.6% in 2020 and closed the year at 24,4 thousand. In 2019, that figure had been 25.0 thousand, with an increase of 10.0%. However, salaried employed persons increased 8.3% against 2019.
“Companies with 250 or more employees were the main contributors to the increase of salaried employed persons. From 2019 to 2020, the participation of these companies went from 8.8% to 9.2% in the total companies,” says Mr. Ferreira.
High-growth companies are those with average increase in the number of salaried employed persons of at least 20% a year, for a period of three years, and have 10 or more salaried employed persons in the initial year of observation.
From 2017 to 2020, salaried employed persons increased by 175.2% in high-growth companies, versus an increase of 13.2% in the group of companies with salaried persons.
Southeast has almost half of the high-growth companies in the country
The Southeast Region has 46.6% of the high-growth companies, followed by the South (20.4%), Northeast (17.0%), Central West (9.6%) and North (6.4%).
As shown in graph 8, the North Region has 1.3 percentage points (p.p.) more in the distribution of high-growth companies than among companies with 10 or more salaried persons, whereas in the Southeast, the opposite is true, with a distribution 1.9 p.p smaller.
Brazil had 2,8 thousand “gazelle” companies in 2020
The participation of “gazelle” companies in the group of high-growth companies remained virtually stable, with a change from 11.2% ( 2 805) in 2019 to 11.4% (2 768) in 2020.
In 2020, the number of salaried persons employed in “gazelle” companies decreased, having fallen from 214,3 thousand in 2019 to 212,4 thousand in 2020. Given this small decrease, 2020 now has reached the third worst level since 2008 (a position previously taken by year 2019). The years 2017 and 2018, both with 198,8 thousand salaried employed persons, complete the list.
“Gazelle” companies are a subgroup of high-growth companies formed by newer entities, having existed 3 to 5 years in the year of reference and that have average annual growth above 20%, in a period of three years.