
Continuous PNAD
Internet reaches 95% of households in the country in 2025


July 02, 2026 10h00 AM | Last Updated: July 16, 2026 04h49 PM
Highlights
- In 2025, there were 76 million households with Internet access (95.0%), an increase of 1.3 percentage points compared to 2024. Growth has been faster in rural areas, narrowing the gap with urban areas: in 2016, this difference was greater than 41.5 percentage points (35.0% versus 76.5%), whereas in 2025 it fell to 7.8 percentage points (88.0% versus 95.8%).
- From 2024 to 2025, the percentage of Internet-connected households using mobile broadband rose again, going from 84.2% to 85.9%, though it remained lower than fixed broadband, which increased from 88.9% to 89.2%.
- The proportion of households receiving analog or digital open TV signals via a conventional antenna fell from 86.5% in 2024 to 85.8% in 2025, despite an absolute increase of 907,000 households.
- In 2025, 18.3 million—or 23.5%—of households with a television had access to a pay-TV service, a decrease of 0.8 percentage points compared to 2024. This proportion was 24.9% in urban areas and 11.6% in rural areas.
- Paid video streaming services were present in 44.4% of households. Among households with a streaming service, 9.0% lacked access to open or pay TV—a figure that stood at 6.1% in 2023 and 8.2% in 2024.
- Conventional landline phones were present in 5.9% of households, while mobile phone ownership reached the highest percentage in the time series in 2025 (97.4%).
- The proportion of households with mobile network coverage for Internet or telephony services was 92.9%, an increase of 0.9 percentage points compared to 2024. This proportion was 96.1% in urban areas (an increase of 0.7 pp) and 68.0% in rural areas (an increase of 2.2 pp). In rural areas, the increase observed in 2025 did not reach the peak rate recorded in 2021.
- Of the 76.0 million households using the Internet, 15.4 million (20.2%) had some type of smart device, representing an increase of 2.1 million households (or 2.2 p.p.) between 2024 and 2025.

Bruno Peres/Agência Brasil
The Internet was used in 95.0% of the country's permanent private households (76.0 million) in 2025, an increase of 1.3 percentage points—or 2.7 million households—compared to 2024. This growth has been more rapid in rural areas, contributing to a significant narrowing of the gap with urban areas: the difference shrank from 41.5 percentage points in 2016 (35.0% versus 76.5%) to 7.8 percentage points in 2025 (88.0% versus 95.8%).
The data come from the Information and Communication Technology (ICT) module of the Continuous PNAD survey, released today (the 2nd) by the IBGE. You can also read the news story on Internet usage among people aged 10 and older and on personal mobile phone ownership.

In the 4.0 million households where there was no Internet use, the three reasons that stood out the most were: no resident knew how to use the Internet (36.5%), Internet access service was expensive (25.9%) and lack of need to access the Internet (25.2%). In the rural area, in addition to the three most alleged reasons, the lack of availability of Internet access service in the home area stood out, which represented 8.9% (12.1% in 2024) of households in which there was no use of the Internet in rural areas, in contrast to only 0.4% in urban areas.
In households that used the Internet, the percentage of those using mobile broadband increased from 84.2% to 85.9%, between 2024 and 2025. The percentage of households that used fixed broadband increased from 88.9% to 89.2% in the same period.
The North Region showed the biggest increase in the percentage of households with fixed broadband (1.5 pp), although it has the lowest proportion among the regions (86.2%). The Northeast Region, with an increase of 0.5 pp in 2024, continues to be the region with the highest proportion (92.8%) of fixed broadband. The lowest percentage of households with mobile broadband was in the Northeast (72.4%), while the other regions had rates above 80%, reaching 91.9% in the Southeast Region.
In 2025, in households that used the Internet, the proportion that used dial-up connection was just 0.2% in Brazil.

Almost 93% of households had mobile cellular network service
In 2025, the percentage of households with mobile cellular network service—whether for Internet or telephony—was 92.9% nationwide; 96.1% in urban areas; and 68.0% in rural areas.
An increase in the number of households with mobile cellular network service for Internet or telephony has been observed since 2016. However, the percentage of households in this category remained stable from 2022 onwards, before rising again in 2025 (0.9 percentage points).

Between 2024 and 2025, there was an increase in the percentage of households with mobile cellular network access; however, in rural areas, the rise observed in 2025 did not reach the peak rate seen in 2021. Since urban households hit a record high in 2025, the gap between these sectors remains significant (28.1 percentage points).
Over 33 million households had access to paid streaming services
In 2025, 33.4 million households had access to paid video streaming services, an increase of 1.5 million compared to 2024. The percentage of households with a television and access to this service rose from 43.4% (2024) to 44.4% (2025). All major regions showed growth, notably the Central-West, which rose by 2.6 percentage points and now leads at 51.5%. Meanwhile, the Northeast region recorded the smallest change (0.7 percentage points) and the lowest rate (30.7%).
Among households with access to paid video streaming services, 91.0% also had access to television channels: 85.7% via open television signals and 38.9% via subscription TV services. Conversely, 9.0% of those with access to paid video streaming did not have access to open television or subscription TV services—a figure that stood at 8.2% in 2024.
The average monthly real income per capita in households with access to paid video streaming services was R$ 3,072, more than double that of households without access to such services (R$ 1,454). For households with paid access to video streaming services and pay-TV channels, the average income was R$ 4,241.
Proportion of households with open TV signals drops from 91.6% to 85.8% over four years
In 2025, 93.9% of households (80.0 million) had a television, with a rate of 94.5% in urban areas and 89.1% in rural areas. The percentage of households with only flat-screen televisions rose from 93.3% to 95.0% between 2024 and 2025. Among households with only CRT (tube) televisions, the percentage fell from 5.2% to 3.9%, while among those with both types, the figure dropped from 1.5% to 1.1%. Income in households with CRT televisions (R$ 1,212) represented 51.1% of the income in those with flat-screen televisions (R$ 2,371). In households with only CRT televisions, the average income was R$ 1,005.
Among households with a television in 2025, 85.8% (64.5 million) received analog or digital open TV signals via a conventional antenna (distinct from satellite dishes or pay-TV services). Despite a 0.7 percentage point drop compared to 2024, there was an absolute increase of 907,000 households.

This percentage was higher in urban areas than in rural areas (86.5% versus 80.2%). Across all Major Regions, this percentage has been declining since 2022, despite relative stability in the number of households using conventional antennas.
Proportion of households using exclusively digital satellite dishes to access TV channels reaches 16.0% of households with a television
Among households with a television in 2025, the percentage with a satellite dish (large or mini, receiving free-to-air signals) was 20.5%, with 53.3% in rural areas and 16.6% in urban areas. The South Region (12.1%) showed the lowest percentage, while the Northeast (36.7%) and North (27.9%) regions recorded the highest percentages of such households.
In Brazil, there has been growth in the adoption of digital mini-satellite dishes, rising from 8.6% to 16.0% of households with a television between 2022 and 2025. During this same period, the number of households with this device increased from 5.8 million to 12.0 million. This is largely due to the replacement of large (analog) satellite dishes with digital units.
Pay-TV service continues to decline, especially in rural areas
In 2025, 17.7 million—or 23.5%—of households with a television had access to pay-TV services, a reduction of 0.8 percentage points compared to 2024. This proportion was 24.9% in urban areas and 11.6% in rural areas, representing decreases of 0.7 and 2.0 percentage points, respectively, compared to 2024.
The Southeast Region continued to have the highest percentage of households with access to pay-TV services (30.0%), while the Northeast Region remained the lowest (11.6%). The Central-West region stands out (24.6%), showing a 2.0 percentage point increase compared to 2024, when it accounted for 22.6%.
The average income per capita in households with pay-TV (R$ 3,746) was more than double that of households without the service (R$ 1,871).
Among households without pay-TV, 26.1% did not hve subscribed TV because they considered it too expensive, and 62.2% because they had no interest in the service. Households that did not have pay-TV because online video content (including shows, movies, or series) served as a substitute accounted for 10.0%, while those without it due to the service being unavailable in their area totaled just 0.9%.
5.6 million households do not have any type of TV service
The number of households with a television that lacked free-to-air analog or digital signal reception, free-to-air satellite reception (via large or mini-dish), and access to pay-TV services rose from 4.9 million in 2024 (6.7%) to 5.6 million in 2025 (7.5%).
Rural households showed higher percentages (8.6%) compared to urban ones (7.3%). The Major Region with the highest percentage of households without access to television channels was the North (9.3%).
Households with a microcomputer: a trend toward stabilization
For the first time since 2016, there was a slight percentage increase in households with a computer in Brazil, rising from 38.5% in 2024 to 38.7% in 2025. Nevertheless, there has been an absolute increase in the number of households with a computer since 2019.

Tablets are less common in households than microcomputers, although their presence is also expanding slightly. From 2024 to 2025, the percentage of households with a tablet rose from 10.7% to 11.6%. The estimated average income for households having neither a microcomputer nor a tablet was R$ 1,350; for those with at least one of them, it was R$ 3,494; and for those with both, it reached R$ 5,298.
Number of households with landlines continues to fall
In 2025, 2.3% of households (1.9 million) had no telephone (landline or mobile), a drop of 0.3 percentage points compared to 2024. The highest proportions were found in the Northeast (4.3%) and North (2.7%) regions, while in the other regions, this percentage ranged from 1.0% to 1.6%.
Conventional landlines were present in 5.9% of the country's households; this percentage—as well as the absolute number—has been declining since 2016 (when it stood at 32.6%). Conversely, the share of households with mobile phones has increased since 2016 (93.1%), reaching the highest percentage in the historical series in 2025 (97.4%).
Radios are still present in 46.9% of households
Approximately 37.5 million households—or 46.9% of the total—owned a radio in 2025, the lowest figure in the time series. Between 2024 and 2025, there was a decrease of 500,000 in the number of households with radios (a drop of 1.7 percentage points). In rural areas, 52.0% of households owned a radio, a higher percentage than in urban areas, where the figure was 46.2%. Among the Major Regions, the only one to show a rate above 50% was the South Region, at 56.0%.
Number of households with smart devices reaches 15.4 million
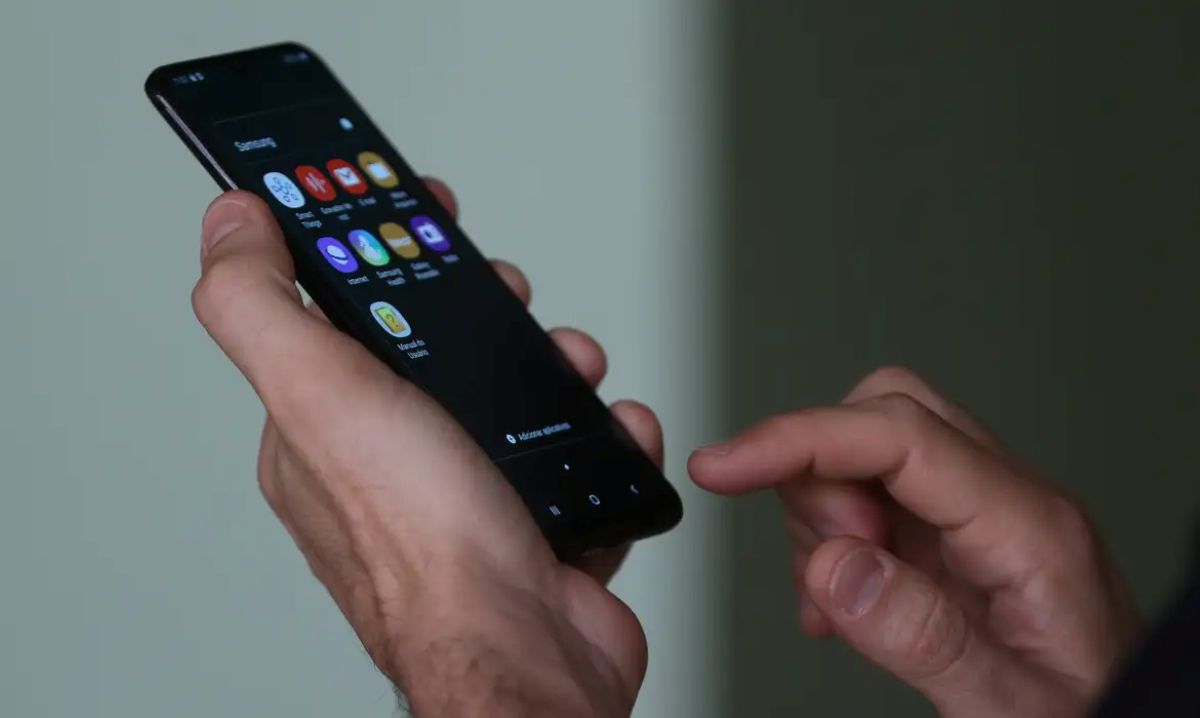
Nationwide, out of the 76.0 million households using the Internet, 15.4 million (20.2%) had some type of smart device—an increase of 2.1 million households (or 2.2 percentage points) between 2024 and 2025. At the start of the data series in 2022, this figure stood at 9.7 million (14.3%). In rural areas, the percentage was considerably lower than in urban areas—11.5% versus 21.2%—despite rural households showing greater growth over the last year (2.7 percentage points).
Regarding the Major Regions, the lowest percentage was recorded in the Northeast Region (13.5%) and the highest in the South Region (27.9%). The Southeast and Central-West regions also posted figures above 20%.
About the survey
Since 2016, the annual Information and Communication Technology (ICT) module of the Continuous National Household Sample Survey (PNAD Contínua) has analyzed Internet and television access, as well as mobile phone ownership for personal use, providing geographic breakdowns for Brazil, Major Regions, and Federation Units. Access the supporting materials and the full publication for further information.
What is the Continuous PNAD?
Concepts and Methods
Tables
Publications