Health Satellite Accounts
Expenditure on health in 2019 represented 9.6% of the GDP


April 14, 2022 10h00 AM | Last Updated: April 18, 2022 12h42 PM
Highlights
- Final consumption expenditure on healthcare in Brazil amounted toR $ 711.4 billion in 2019. That is equivalent to 9.6% of the GDP that year.
- Households and non-profit institutions serving households accounted for most of the expenditure R$ 427.8 of the total, corresponding to 5.8% of the GDP.
- Government consumption expenditure on healthcare amounted to R$ 283.6 billion, which represents 3.8% of the GDP.
- Expenditure on health in the country, as a proportion of GDP (9.6%), is not very far from the average (8.8%) of selected countries from the Organisation for Economic Cooperation and Development (OCDE). However, the participation of some of them is below the average, for example, Germany (11.7%), France (11.1%) and United Kingdom (10.2%).
- In 2019, per capita consumption of healthcare goods and services a despesa per capita of households and non-profit institutions serving households recached R$ 2,035.6, whereas that of the Government was R$ 1,349.6.
- Entre as famílias, a principal despesa relacionada à saúde foi direcionada aos serviços privados.
Health-related expenditure in the country in 2019 amounted to R$711.4 billion, which is equivalent to 9.6% of the Gross Domestic Product (GDP), which is the sum of all goods and services produced in Brazil in the year. This proportion was the biggest in the Health Satellite Account time series, initiated in 2010. Data were released today (14) by the IBGE.
As in previous years, non-profit institutions serving households were responsible for the biggest part of these expenses. They accounted for R$427.8 billion out of the total, which corresponds to 5.8% of the GDP, whereas R$283.6 billion (3.8% of the GDP referred to government consumption expenditure. The participation of households and of these institutions in expenditure on health has increased since 2011, whereas that of the government, which had increased between 2013 and 2016, remained stable after a decrease in 2017.
“The analysis is from the perspective of those who pay, although households are the final beneficiaries of these health services. Between 2011 and 2019, an upward curve shows the participation of households and institutions in healthcare household consumption. On the other hand, there is a decrease in participation of the government in this type of expenditure. So the increase of consumption of healthcare goods and services in relation to GDP is explained by the increase of household participation,” says the survey analyst Tassia Holguin.

The researcher highlights that, since government expenditure is ruled by budget control laws, this participation tends to be stable as years go by, in case there are no changes in SUS funding rules, whereas the participation of households records increase, among other reasons, because of population aging and the advance of technology. “Expenditure includes procedures, such as appointments and exams, and expenses related to health insurance, which play an important role. Besides the advance of age, which leads people to spend more on health, there are new technologies making possible, today, procedures that were not viable in the past.”
The survey also shows that expenditure on health in the country, as a proportion of the GDP, is close to the average (8.8%) of countries selected from the Organisation for Economic Co-operation and Development (OCDE), although below the participation of nations such as Germany (11.7%), France (11.1%) and United kingdom (10.2%). Brazilian public expenditure on healthcare in relation to the GDP (3.8%) is below the participation of most of these selected countries, only above the result of Mexico (2.7%).

With the per capita expenditure indicator, the survey shows how much each country spends on health per resident. In 2019, per capita expenditure on healthcare goods and services by households and non-profit institutions serving households reached R$2,035.6. Per capita expenditure related to this segment reached R$1,349.6.
It is possible to compare the capacity of consumption of healthcare products by residents of Brazil to that of other countries by using the purchasing power parity. This way, it is possible to observe that per capita expenditure in Brazil, although higher than figures in Latin American countries such as Colombia and Mexico, are almost three times smaller than the average of OECD members.
By observing the time series of the survey, it is also possible to realize that the final consumption of goods and services of the healthcare sector has been less affected during periods of crisis than other sectors of the economy. In 2015, year when GDP fell 3.5%, the volume of consumption of goods and services increased 1.1%, whereas sectors not related to healthcare fell 3.3%. In the following year, non-healthcare services fell 3.0% and healthcare services recorded a smaller decrease, of 1.5%.
“That takes place because, since goods and services are essential, even at times of crises, the change is smaller than in other activities. It is not an expense that can be cut down on at first. However, during prolonged economic crises, a decrease in the consumption of healthcare goods and services is also expected,” the analyst says.
Private services concentrate 67.5% of the expenditure on household healthcare
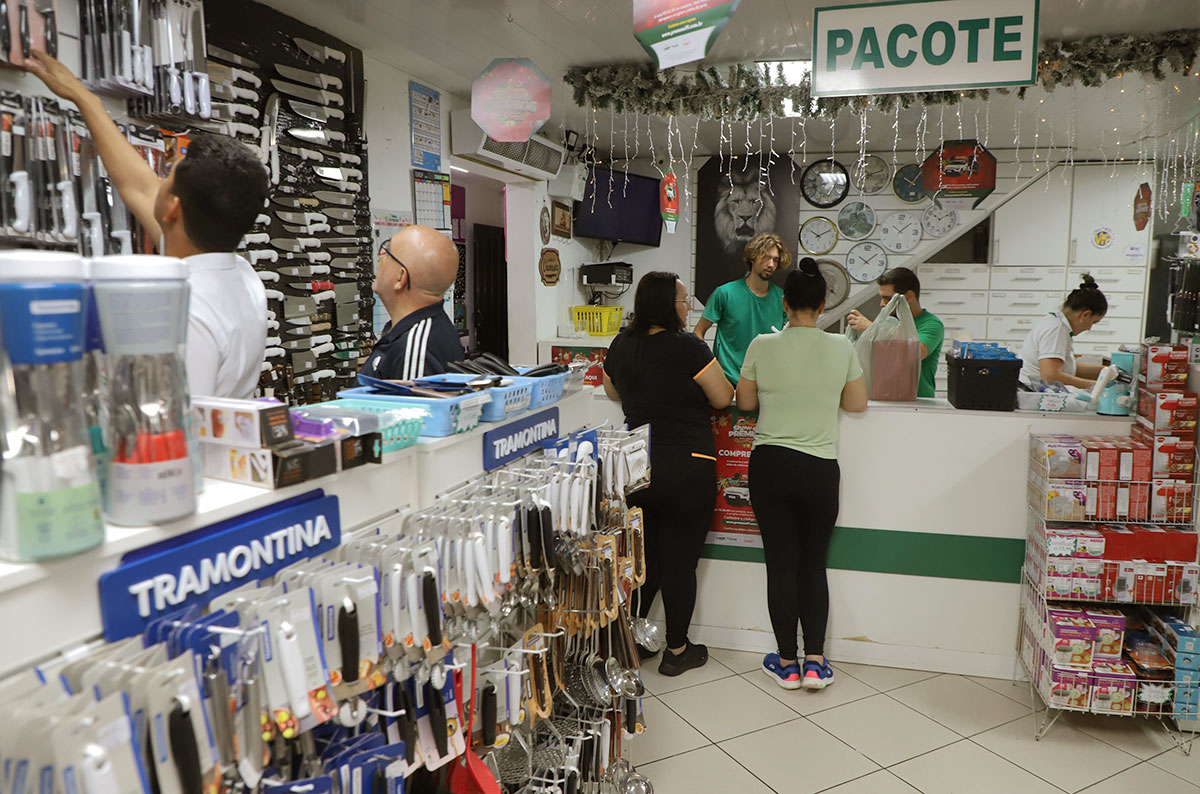
Private services were the main item in household expenditure on healthcare, accounting for 67.5% in 2019. Expenditure include the amount paid to health care plans, including in the case when payment is a duty of the employers, and also expenditure on insurance.
Expenditure on medicines corresponded to 29.3% of the total healthcare consumption by households, reaching R$122.7 billion. But not all medicines consumed by households are included in this account: those distributed by the government for free are public expenses. They represented 3.3% of the final government consumption expenditure and amounted to R$9.3 billion.
On the other hand, in the Health Satellite Account, government expenditure does not encompass subsidies for the Popular Pharmacy Program, whose objective is to reduce medicine costs for the population. This provision of medicines at lower prices generated an expense of R$2.3 billion in 2019, an amount that represents a nominal decrease of 17.2% in relation to costs in 2017 (R$2.8 billion, in nominal value), highest level in the time series.
A total of 73.1% of expenditure on medicines in Brazil were directed to the final consumption of households, a decrease in relation to the figure in 2010 (75.6%). The remaining was used mainly in intermediate consumption, that is, in inputs for rendering of public or private healthcare services. This account encompasses, for example, medicines consumed in hospitals. In 2019, the participation of intermediate private healthcare consumption in the total medicines consumed reached 14.8%, being above the proportion in 2010 (9.8%). In public health, there was an increase from 4.3% to 4.7% in this period.
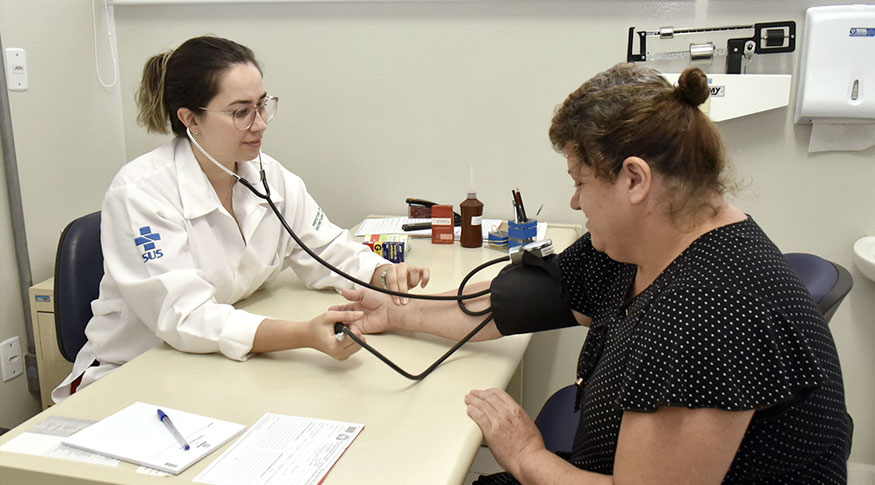
Most government expenditure was directed to public health (R$225.9 billion or 3.1% of the GDP), which includes emergency and ambulatory care, surgeries and exams, among other services. In second place comes private healthcare, with expenditure amounting to R$48.5 billion in 2019. “When a patient needs public healthcare and cannot receive the service at that moment, they can be sent to a philanthropic institution or to a private one and the government pays for those services. That is listed among government expenditure as private healthcare service,” Tassia says.
More about the survey
The publication Health Satellite Account 2010-2019 systematizes information on consumption and foreign trade of healthcare goods and services and job posts in healthcare activities. For further information see the support material and the complete publication.