Continuous PNAD dashboard
Interactive dashboard spatializes data from Continuous PNAD and introduces new regional sections


May 04, 2022 10h00 AM | Last Updated: May 04, 2022 06h38 PM
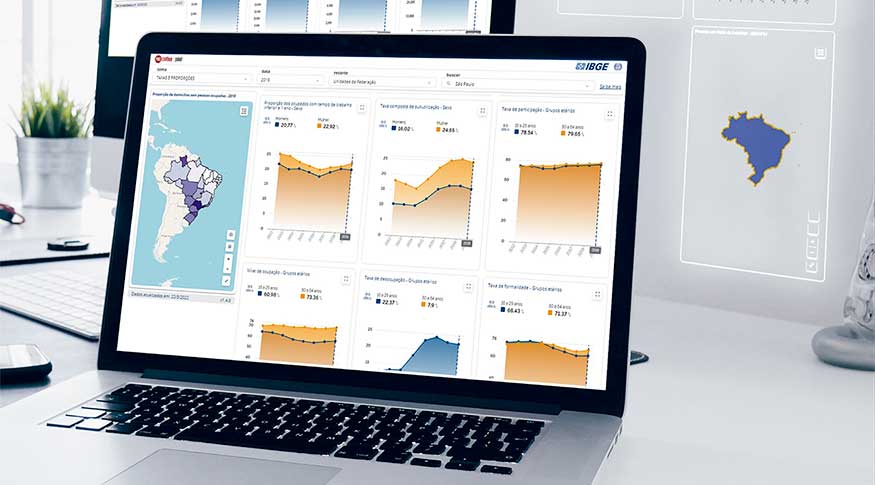
Data on labor market, population, education and access to TV, internet and cell phones, investigated by the Continuous National Household Sample Survey (PNAD), can now be accessed in an interactive dashboard on the IBGE website. The tool, launched today (May 4), in partnership with the International Labor Organization (ILO), spatializes and facilitates the visualization of information from the largest household survey in the country, through maps and interactive graphs.
The dashboard also provides, for the first time, experimental indicators for 146 geographic strata, such as Baixada Santista, Agreste da Paraíba, South Coast of Bahia and North of Minas Gerais, never disclosed before by the survey.
With the dashboard, users can browse 24 indicators selected from the entire time series of the Continuous PNAD, which began in 2012. Some of the indicators are data on occupation, unemployment and the population number, published by the quarterly edition of the survey. Illiteracy and schooling rates are also available, in addition to the total number of households with television, cell phones and Internet access, surveyed by the annual version.
“All this volume of information has been disseminated by publications and Sidra - the IBGE's database of statistical tables. The dissemination in the form of an interactive dashboard facilitates the consumption of information through different geographical sections, showing the evolution of indicators over time and their distribution in space, through interactive graphs and maps", explains the IBGE manager of Integration of Geoinformation Production, Aline Lopes Coelho.


Geographic strata expand regional analysis of data
The dashboard presents these indicators by sections already known, such as Country, Major Regions, Federation Units, Metropolitan Areas and Capitals. Now, the survey will also make available, through the dashboard, indicators by geographic strata, which allow an analysis of smaller geographic sections, in addition to Metropolitan Areas and Capitals. See here the list of municipalities that make up each unit of the geographic strata.
“The creation of geographic strata is in line with the IBGE's initiative to enhance and encourage the use of different sections for the production and dissemination of surveys, becoming even more relevant when considering the significant socio-spatial heterogeneity existing within each of the Federation Units”, says IBGE coordinator of Labor and Income, Adriana Beringuy.
In the dashboard, when browsing the map of the state of Minas Gerais, for example, users can see that the unemployment rate of the geographic stratum corresponding to the North of Minas was 13.2% in the 4th quarter of 2019. In the stratum referring to the South of Minas, the rate was lower, 7.6%. And in the entire state of Minas Gerais, the unemployment rate reached 9.6% in that period.
The most recent data on geographic strata are from 2019 due to the effects of the pandemic on the collection of the Continuous PNAD which, in 2020 and 2021, affected the response rate and the disclosure of some indicators.
“These strata enhance the analysis of regional data, because they penetrate the states and show, with smaller geographic sections, the potential of the job market and other household characteristics. It's a very big step forward. We are witnessing a historic moment. For the first time, a household survey goes beyond the limits of the capital municipality and reaches the point we are now”, emphasizes IBGE Director of Surveys, Cimar Azeredo.
For the president of the IBGE, Eduardo Rios Neto, the new strata meet a demand from the public administration. “This disclosure meets the wishes of state-planning bodies, which demanded interstate statistics, but bumped into the high costs of conducting state household surveys. Researchers will also find a new source to analyze economic dynamics in space,” adds the president.
The Continuous PNAD Dashboard is also integrated into the Interactive Geographic Platform (PGI), through which users with more advanced skills can cross-reference information with the various products of the IBGE Directorate of Geosciences. Just by clicking on the eye symbol on the map of the dashboard, users will have access to the data of the panel linked to the PGI, being able to compare, for example, information on labor market with population flows throughout the municipalities, as captured by the survey Areas of Influence of Cities (Regic).
ILO will also launch dashboard with IBGE's support
Developed by the Directorate of Geosciences, with the support of the Directorate of Surveys and the Directorate of Data Processing, based on a technical cooperation agreement between the IBGE and the International Labor Organization (ILO), the dashboard improves the visualization of PNAD data, a trend that facilitates the understanding and use of the survey information by its various users.
The coordinator of Knowledge Base to Support the Promotion of Decent Work from the ILO office in Brazil, José Ribeiro, highlights that, “based on data from the Continuous PNAD, the ILO has developed several strategic products aimed at expanding the knowledge base on Decent Work in the country with the aim of providing data for the elaboration of policies and actions to promote the initiative, including in subspaces of the Federation Units”.
The Continuous PNAD Dashboard - Decent Work will be available on May 11 onwards on the ILO Brazil website and will bring 18 indicators and information such as employed population, income of employed population, working hours and unemployment and formality rates.
More about Continuous PNAD
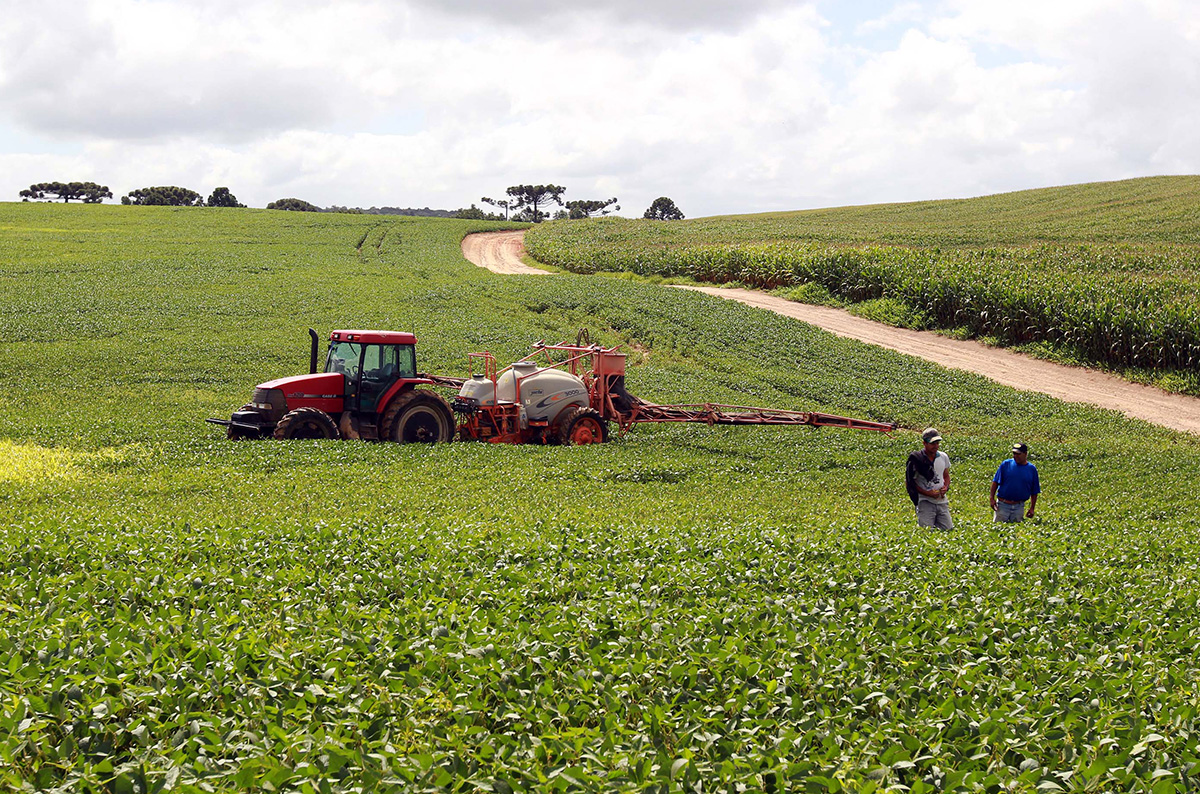
Started in 2012, the Continuous PNAD produces information on the population's insertion in the labor market according to demographic and educational characteristics. It also generates annual results, intended for the study of the country's socioeconomic development, on topics such as child labor and other forms of work, personal care and household chores, information and communication technology and other relevant aspects, selected according to information demands.
The survey is carried out through a probabilistic sample of households, extracted from a master sample of enumeration areas, in order to guarantee the representativeness of the results for the different geographical sections in which the survey is produced. Every quarter, the Continuous PNAD investigates around 211 thousand Brazilian households. Since its implementation, the survey has gradually expanded the indicators and established itself as the main household survey in the country.