IPP
Industry prices increase 2.63% in April influenced by petroleum supply chain


May 28, 2026 09h00 AM | Last Updated: May 29, 2026 12h57 PM

Influenced primarily by the petroleum supply chain, prices in the national industry rose 2.63% in April compared to March (2.28%), reaching the highest result since March 2022 (3.12%). Over the last 12 months, the index stood at 1.07%, the first positive result since August 2025 (0.47%). The cumulative increase for the year was 5.12%, the third highest ever recorded for an April since the beginning of the time series in 2014.
The information comes from the Producer Price Index (PPI) for Mining and Quarrying and Manufacturing Industries, released today by the IBGE. The survey measures "factory-gate" prices of products, excluding taxes and freight, and covers the broad economic categories.
A total of 21 of the 24 industrial activities investigated in the survey showed positive price changes compared to the immediately preceding month. In comparison, 19 activities had shown higher average prices in March compared to April.
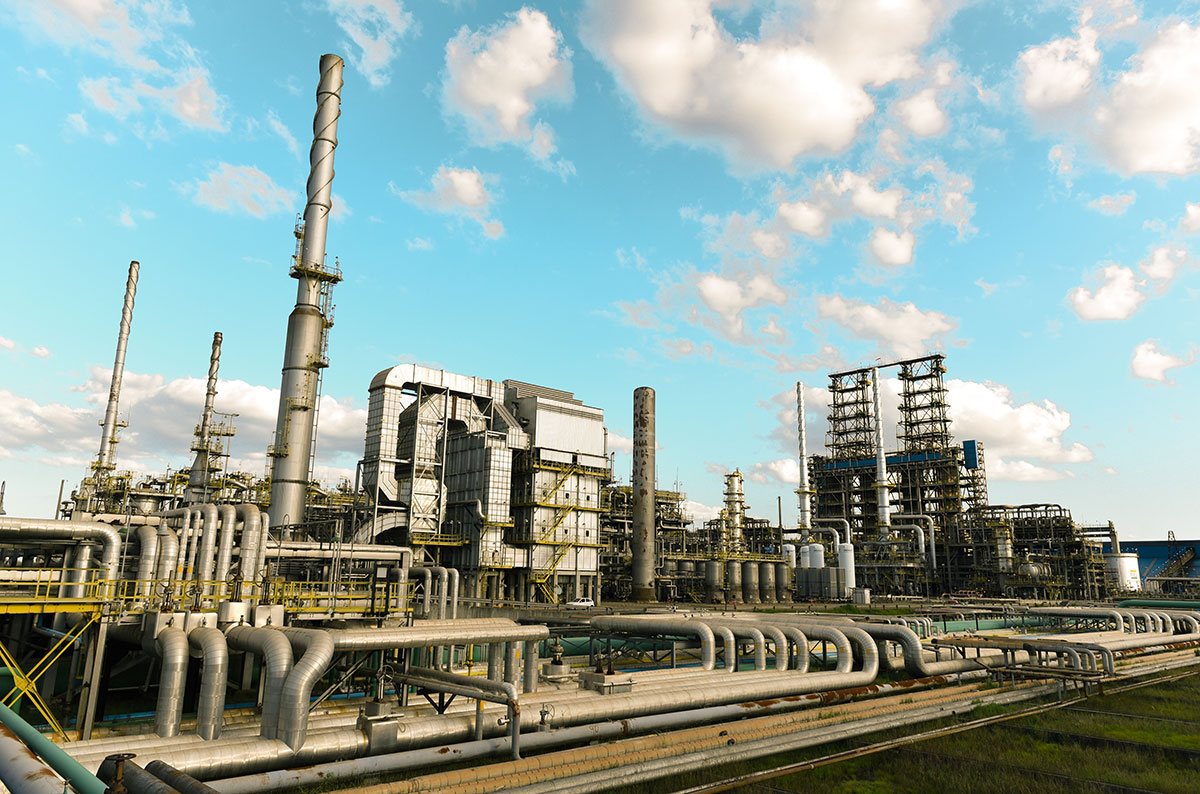
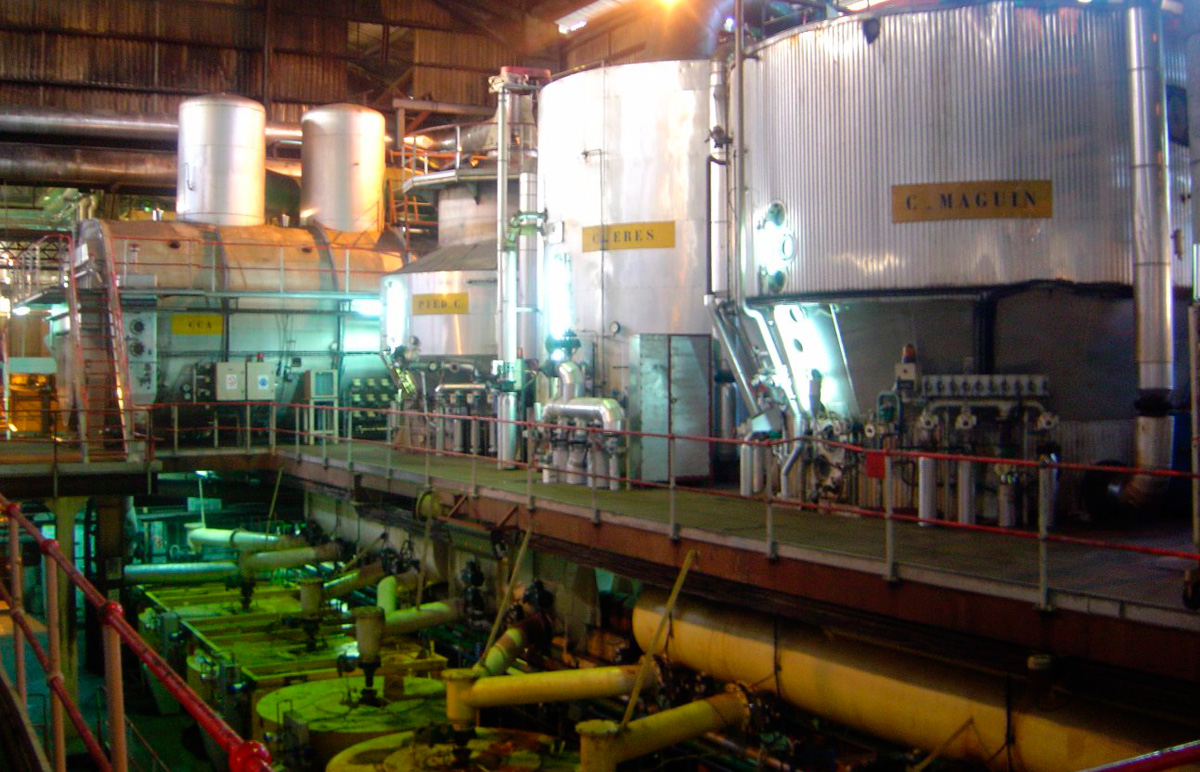
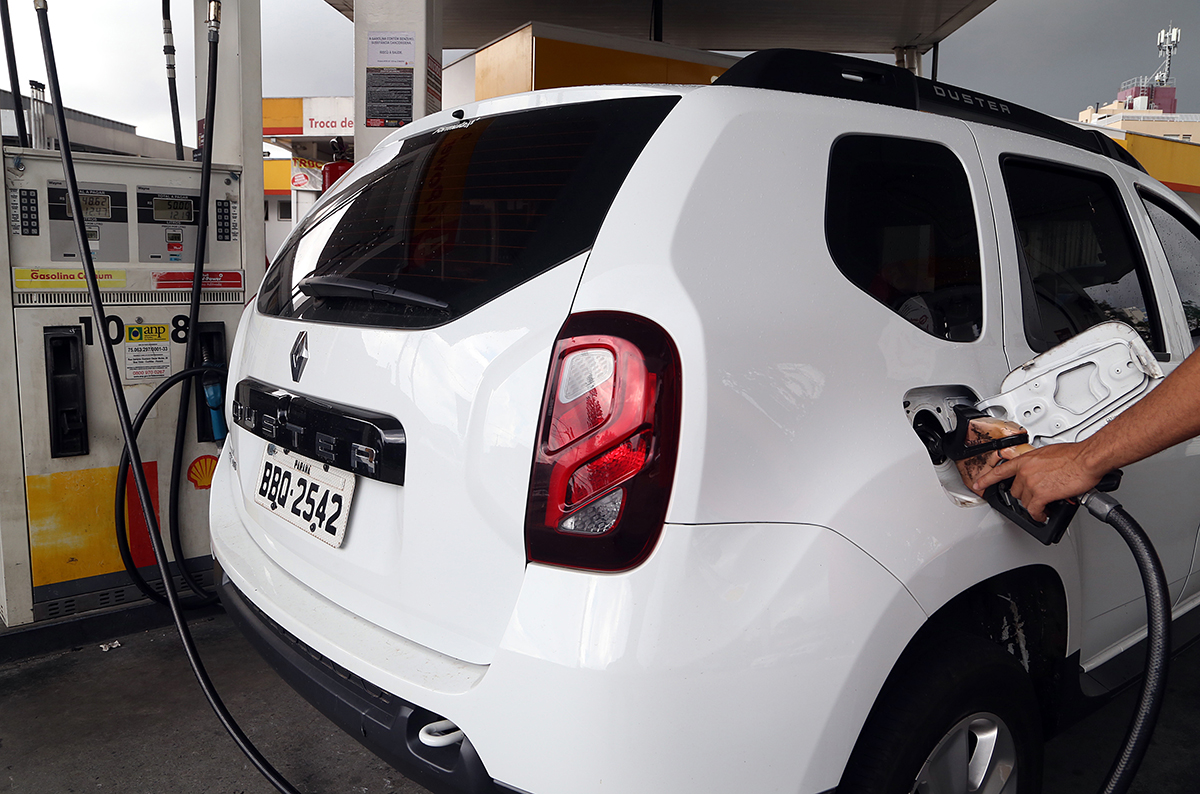
The four most significant changes were in other chemical products (9.91%); rubber and plastics (7.31%); petroleum refining and biofuels (6.44%); and Mining and Quarrying industries (4.92%).
According to Alexandre Brandão, manager of analysis and methodology, the April IPP results were strongly influenced by the international context:
“The explanation for the impact on the petroleum chain lies in the conflict of the United States and Israel against Iran. So, if we look at the positive result in April against March 2026 (2.63%), we see that it is the highest result since March 2022, when it reached 3.12%. It is interesting to note that these are two moments in which international conflicts are impacting these production chains. Back in 2022, it was the beginning of the war between Russia and Ukraine.”
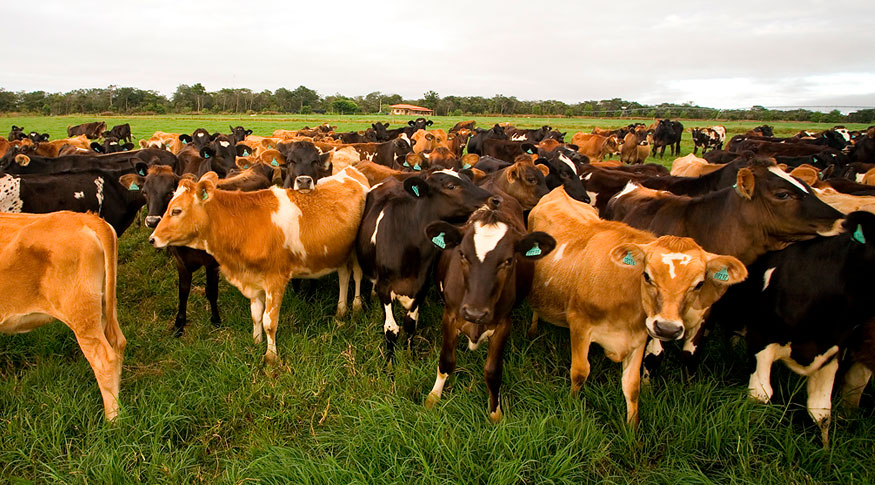
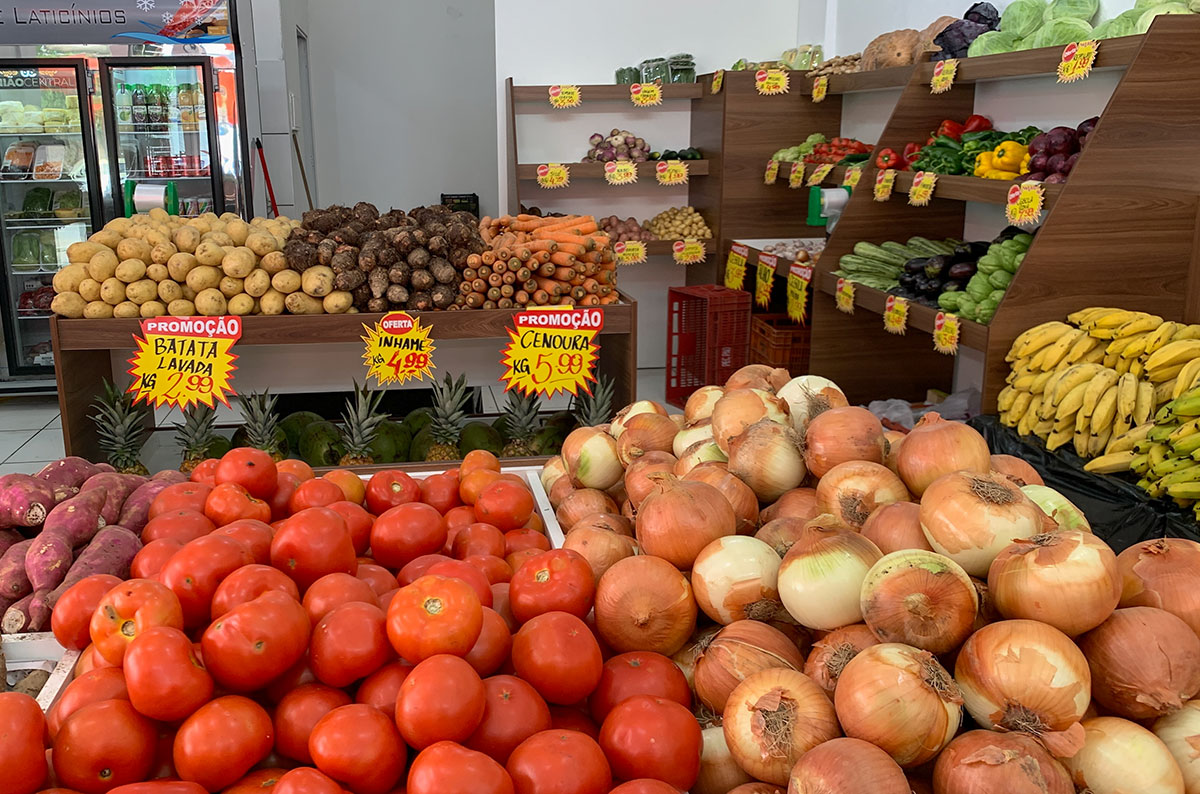
Among the four main influences on the March index, three are part of the crude petroleum derivatives chain. In this sense, Other chemical products was the most prominent industrial sector in the composition of the aggregate result, when comparing prices in April and March. This activity was responsible for 0.80 percentage points (pp) of influence on the 2.63% change in overall industry. Also noteworthy in this category were petroleum refining and biofuels, with 0.63 pp of influence, food (0.34 pp) and rubber and plastics (0.29 pp).
From the perspective of the broad economic categories investigated by the survey, the main influence in April came from Intermediate goods (2.23 pp). Alexandre Brandão highlights that of the ten products that make up Intermediate goods, nine had positive changes in April – eight of them being part of the petroleum chain.
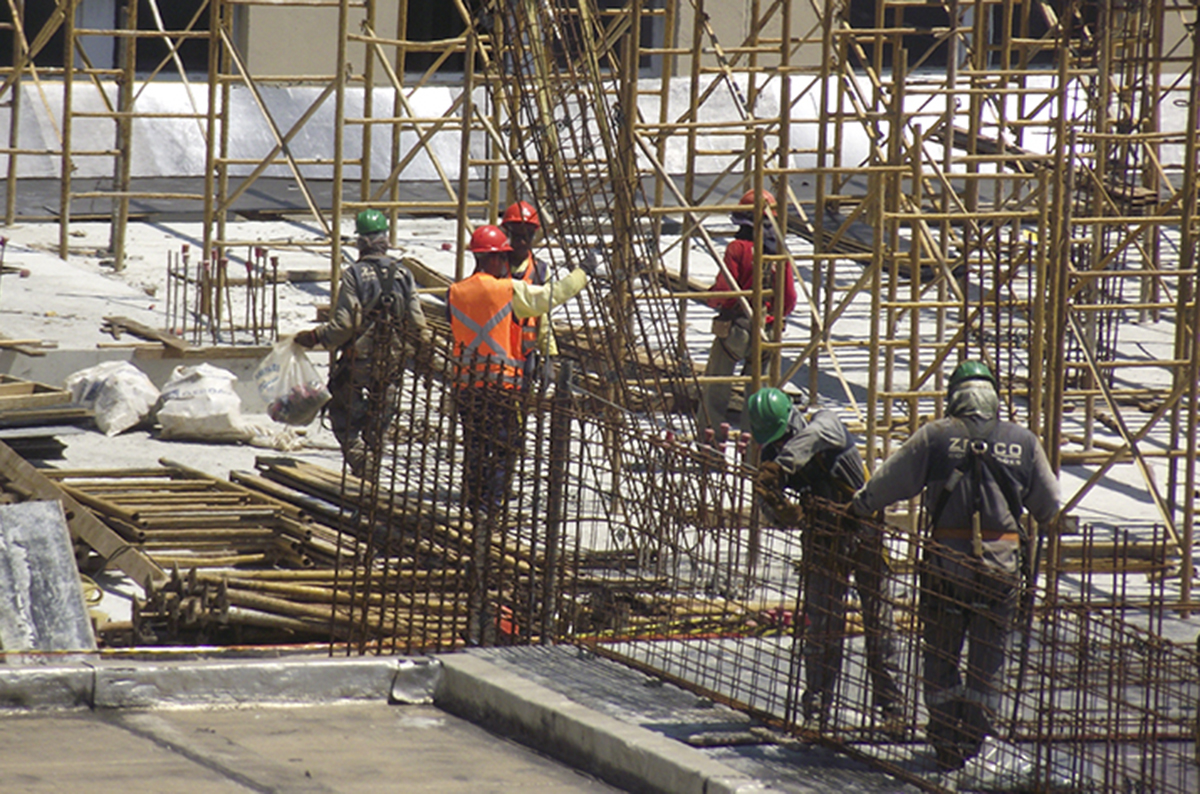
“The only sector out of this upward trend is iron ore, due to increased supply in both Brazil and Australia, as well as high inventories in China because of lower demand in the construction sector. Another factor is the exchange rate, with the appreciation of the real against the dollar,” explains the manager.
Learn more about the IPP
The IPP tracks the average change in sales prices received by domestic producers of goods and services, and their evolution over time, signaling short-term inflationary trends in the country. It is an essential indicator for macroeconomic monitoring and a valuable analytical tool for public and private decision-makers.
The survey investigates, in more than 2,100 companies, the prices received by the producer, free of taxes, tariffs and freight, defined according to the most common commercial practices. Approximately 6,000 prices are collected monthly. The complete IPP tables are available on Sidra. The next IPP release, referring to May, will be on June 30th.
What is the IPP?
Time Series
Tables
Publications