Censo 2022
2022 Census: Brazil has 391 Indigenous ethnicities and 295 Indigenous languages


October 24, 2025 10h00 AM | Last Updated: October 29, 2025 11h41 PM
Highlights
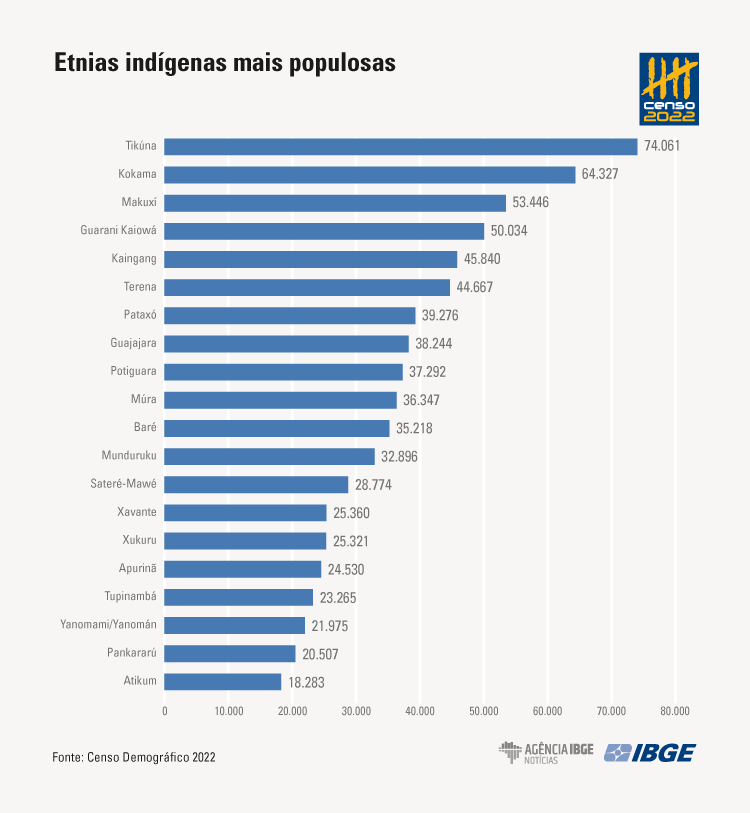
- The 2022 Population Census shows there are 391 Indigenous ethnicities, peoples and groups living in Brazil. Brasil. The three most populous ethnicities are Tikúna (74,061), Kokama (64,327) and Makuxí (53,446). In the 2010 Census, there were 305 different ethnicities.
- Among the 29 ethnicities with more than 10 thousand peoples, the biggest percentage of residents is found in the Yanomami/Yanomán Land, with 94.34%, followed by the Guajajara (80.28%) and Xavante (79.5%). The ethnicity with the lowest percentage of residents of Indigenous Lands is found in the Tupinambá Land, with only 1.21%.
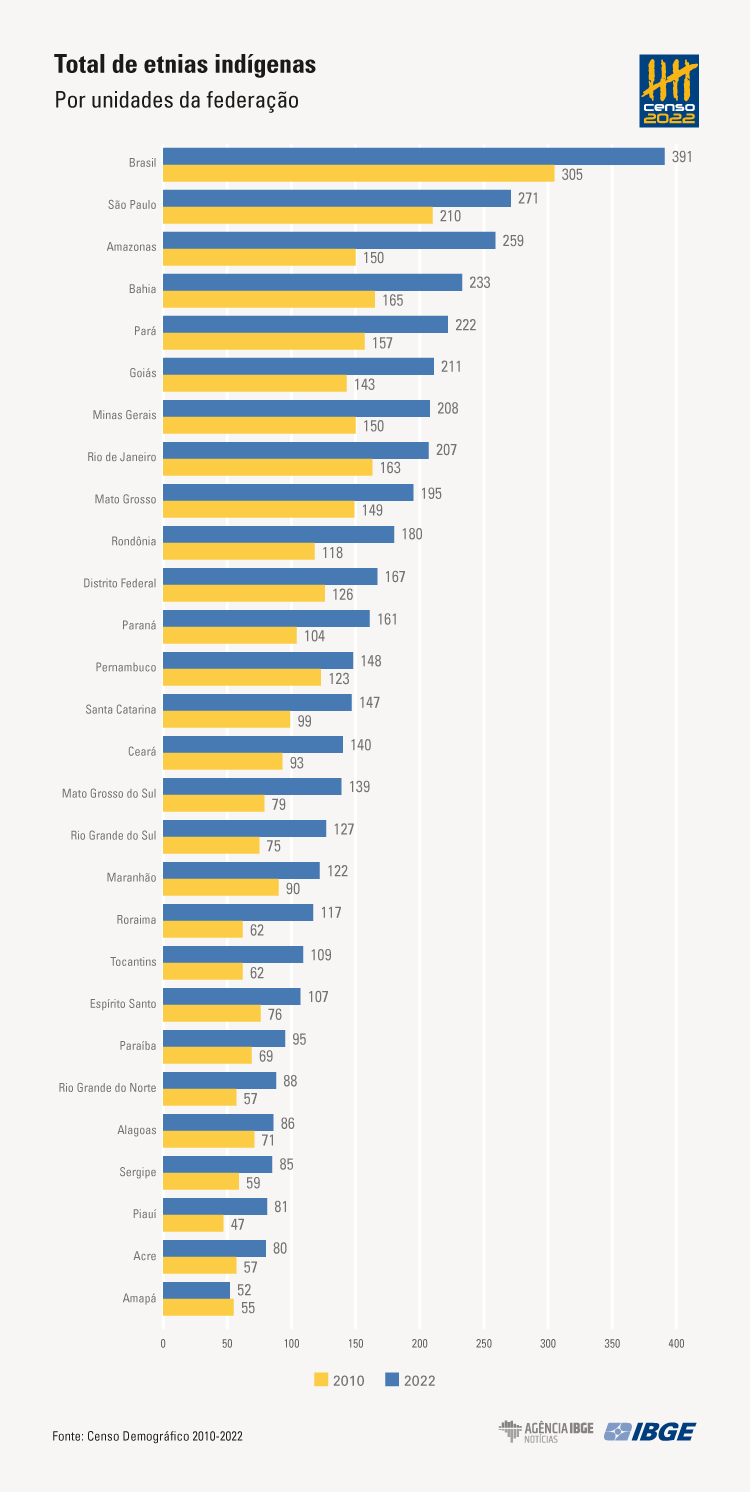
- São Paulo is the Federation Unit with the biggest number of ethnicities (271), followed by Amazonas (259) and Bahia (233).
- In 2022, there were 295 Indigenous languages spoken by Indigenous peoples aged 2 years of age and over. The three languages with most speakers are: Tikúna (51,978), Guarani Kaiowá (38,658) and Guajajara (29,212). In 2010, 274 languages were identified among persons aged 5 and over. Between 2010 and 2022, the number of speakers of Indigenous languages among Indigenous persons aged five and over increased from 293,853 to 433,980. Nevertheless, the percentage fell from 37.35%, in 2010, to 28.51%, in 2022.
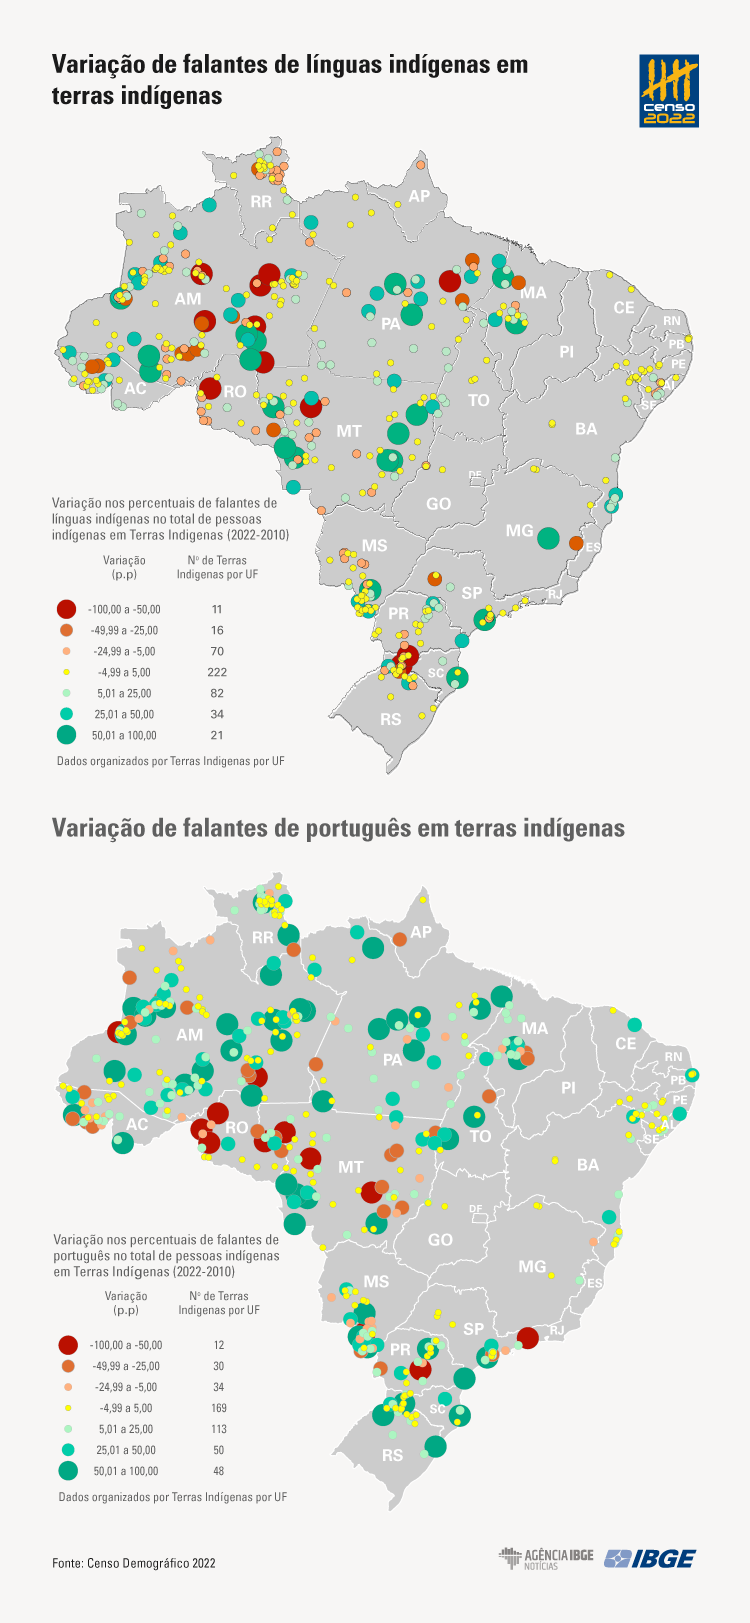
- Among persons aged five and over, the percentage of non-speakers of Portuguese fell from 17.49% (2010) to 11.93% (2022). on the other hand, inside Indigenous Lands, non-speakers of Portuguese increased from 28.85%, in 2010, to 30.96%, in 2022.
- Of the 308 thousand Indigenous persons aged 15 and over who speak Indigenous languages, 78.55% (242 thousand) are literate, with a literacy rate below that of Indigenous persons as a whole (84.95%).
- The percentage of children of up to five years without a birth certificate was 5.42%, 4.91 p.p. above that of the population aged five and over in Brazil (0.51%).

Data from the 2022 Population Census show the existence of 391 Indigenous ethnicities, peoples or groups in Brazil. Of the total Indigenous population in 2022 (1,694,836 persons), 74.51% reported their ethnicity, being the most populous ones: Tikúna (74,061), Kokama (64.327) and Makuxí (53,446). In the 2010 Census, there was a total of 896,917 different Indigenous persons and 305 ethnicities .
The Census identified 295 Indigenous languages, with 474,856 speakers aged two and over. The three languages with most speakers are: Tikúna (51,978), Guarani Kaiowá (38,658) and Guajajara (29,212), but the survey included languages spoken by smaller groups and even by a single person. In 2010, a total of 274 were identified among Indigenous persons aged five and over.
Between 2010 and 2022, there was an increase in the number of speakers of Indigenous languages among Indigenous persons afed five, with a change from 293,853 to 433,980 speakers. However, in percentage ters, there was a drop in the period: with a change from 37.35% to 28.51%. On the other hand, inside Indigenous Lands, the share of speakers of Indigenous Lands increased, from 57.35%, in 2010, to 63.22%, in 2022.
These data come from the 2022 Population Census: Indigenous ethnicities and languages - Main sociodemographic characteristics - Population results, released today (24) by the IBGE.
The launch will take place at 10:00 a.m. at the Unicamp Institute of Geosciences in Campinas, São Paulo (SP). It will be streamed live on Digital IBGE. Data are available on the IBGE website and on platforms such as SIDRA, the Census Overview and the lnteractive Geographic Platform (PGI), being viewed as interactive maps in the two latter platforms.
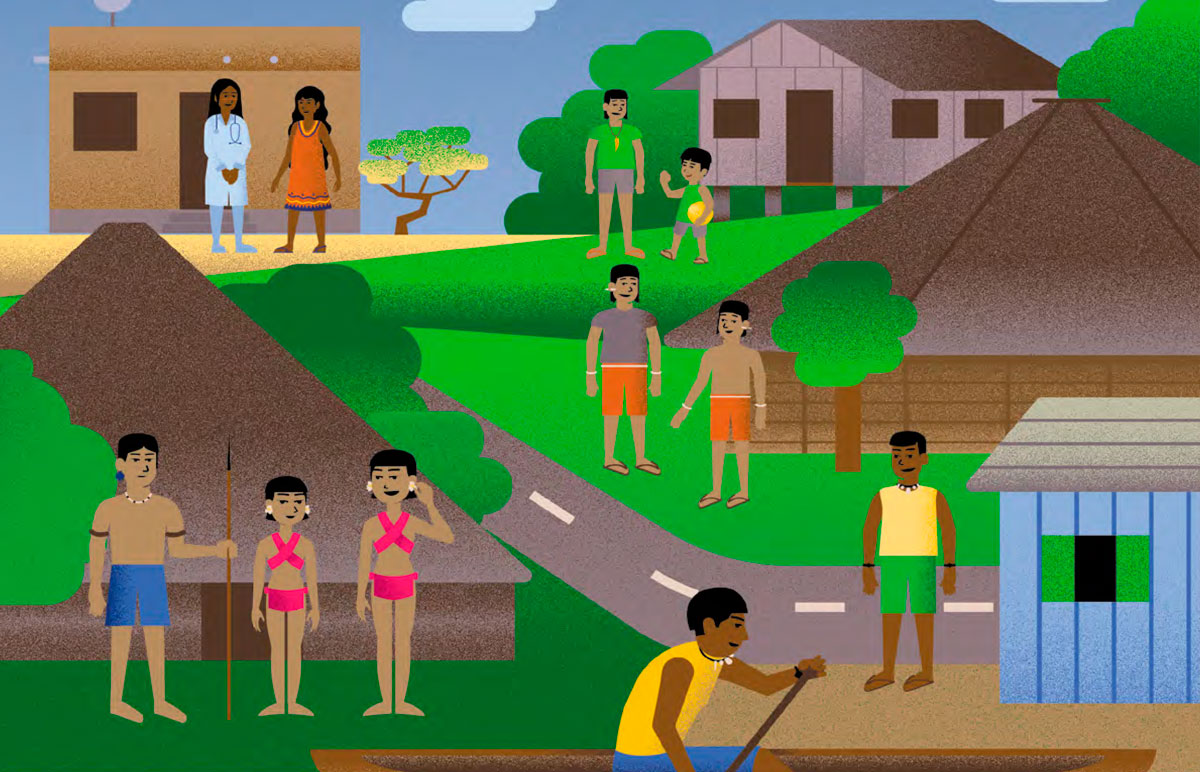
Marta Antunes, manager for Traditional Peoples and Communities and Specific Population Groups at the IBGE, highlights that the importance of this release lies in the portrait of the Indigenous diversity in the country. “Brazil, when compared to other Latin American countries, has this ethnic and linguistic diversity. This significant number of ethnicities and of languages spoke. At the same time, we have seen this increase in the Indigenous population between 2010 and 2022, of almost 90%. So, there was a lot of curiosity: who are these people?”
Brasil records a significant increase in Indigenous ethnic diversity
With the increase in the number of ethnicities from 305, in 2010, to 391, in 2022, it was observed that, inside Indigenous Lands, there were 335 Indigenous ethnicities, peoples or groups in 2022, a figure above that in 2010, which was 250. A total of 373 ethnicities, peoples or groups were found living outside Indigenous Lands in 2022 and 300 in 2010.
The results highlights the many forms of social organization of Indigenous peoples and multiple factors should be considered to analyze them, such as migration movements, the urbanization process, self-affirmation and ethnic resurgence processes that are observed when Indigenous peoples reaffirm their differences from other groups and the non-Indigenous society. “These were self-declared Indigenous people who did not claim to belon to a specific people or group, but that, over the years, have valued this belonging as a result of different socio-organizational processes. That has been better valued over the last few years,” explains Marta Antunes. “Reporting to the IBHE your belonging to that ethnicity is valued action. After years of hiding to dealt with racism, mainly in the urban environment, now there are favorable conditions for self-declaration of ethnic belonging.”
Besides the declaration of 75 new ethnicities, not informed in 2022, Marta explains that other factors add to an increase in the number of ethnicities, such as disaggregation of subgroups identified as belonging to different ethnicities, also recent migration (for example, that of Venezuelan Indigenous people, and improvements in data collection and validation during the 2022 Census.
In 2022, 73.08% of residents reported to belong to at least an ethnicity. The Census investigated, for the first time, a double report of ethnicity, which allows Indigenous people to report their double ethnic belonging, and 1.43% of the total of Indigenous peoples reported double belonging.
“Some people claim to belong to the ethnicities of their father and their mother. It was not possible for the IBGE to ask the informant which is the main one. That is a singularity we were able to identify,” Marta Antunes explained.
The double ethnic belonging is most common among youngsters up to 29 years of age living Indigenous Lands. In the analysis by sex, few differences are observed in the participation of women and men in the ethnicities reported as the only or double.
Outside Indigenous Lands, it is important to consider the different dynamics observed by urban or rural location of the housing unit. In 2022, the Indigenous population outside Indigenous Lands in urban areas increased significantly, from 324,834 persons in 2010 to 844,760 persons in 2022. In rural areas outside Indigenous Lands there was a smaller decrease, from 80,663 persons in 2010 to 227,232 persons in 2022.
São Paulo has the biggest number of Indigenous ethnicities, peoples or groups
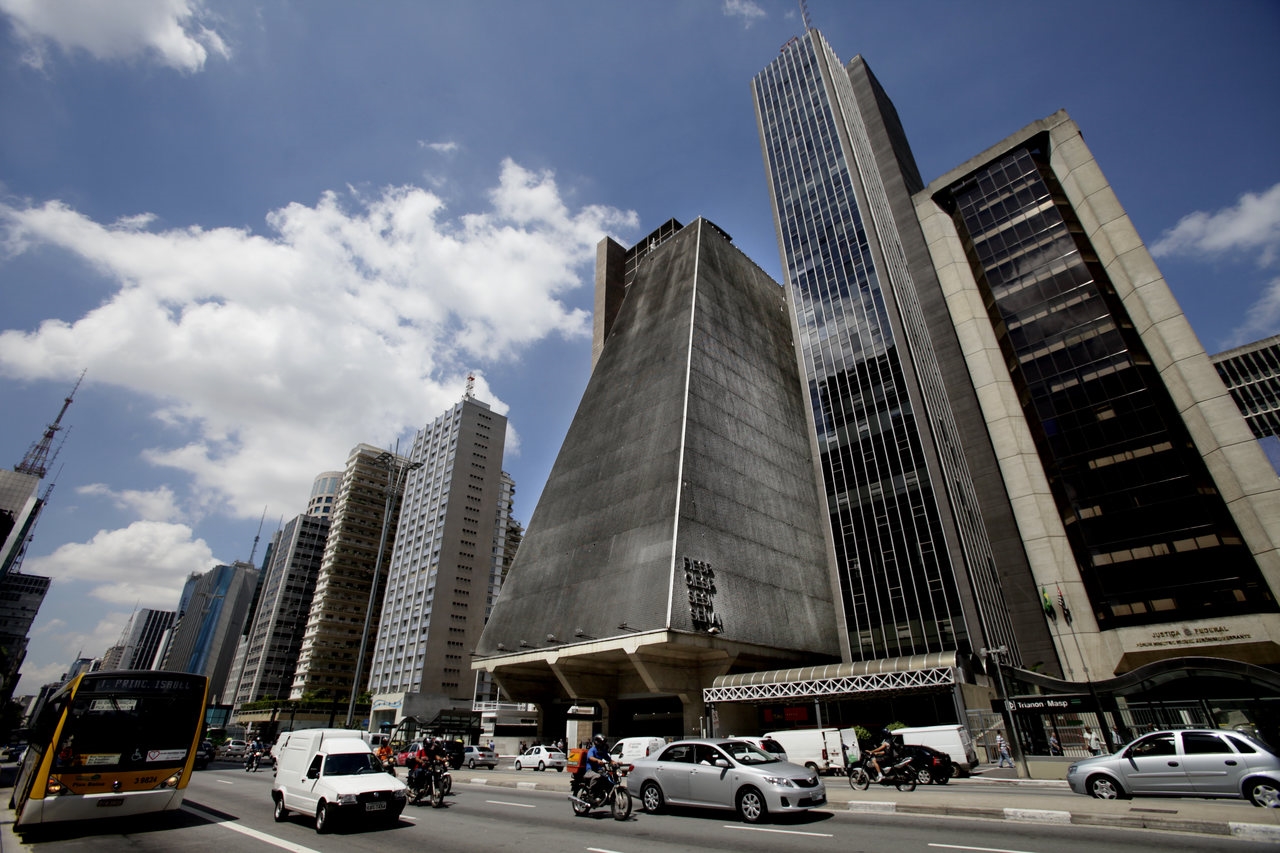
São Paulo is the Federation Unit with the biggest number of Indigenous ethnicities, peoples or groups identified by the Census. A total of 271 ethnicities were reported. Amazonas comes in seconc place, with 259 ethnicities, and Bahia, with 233.
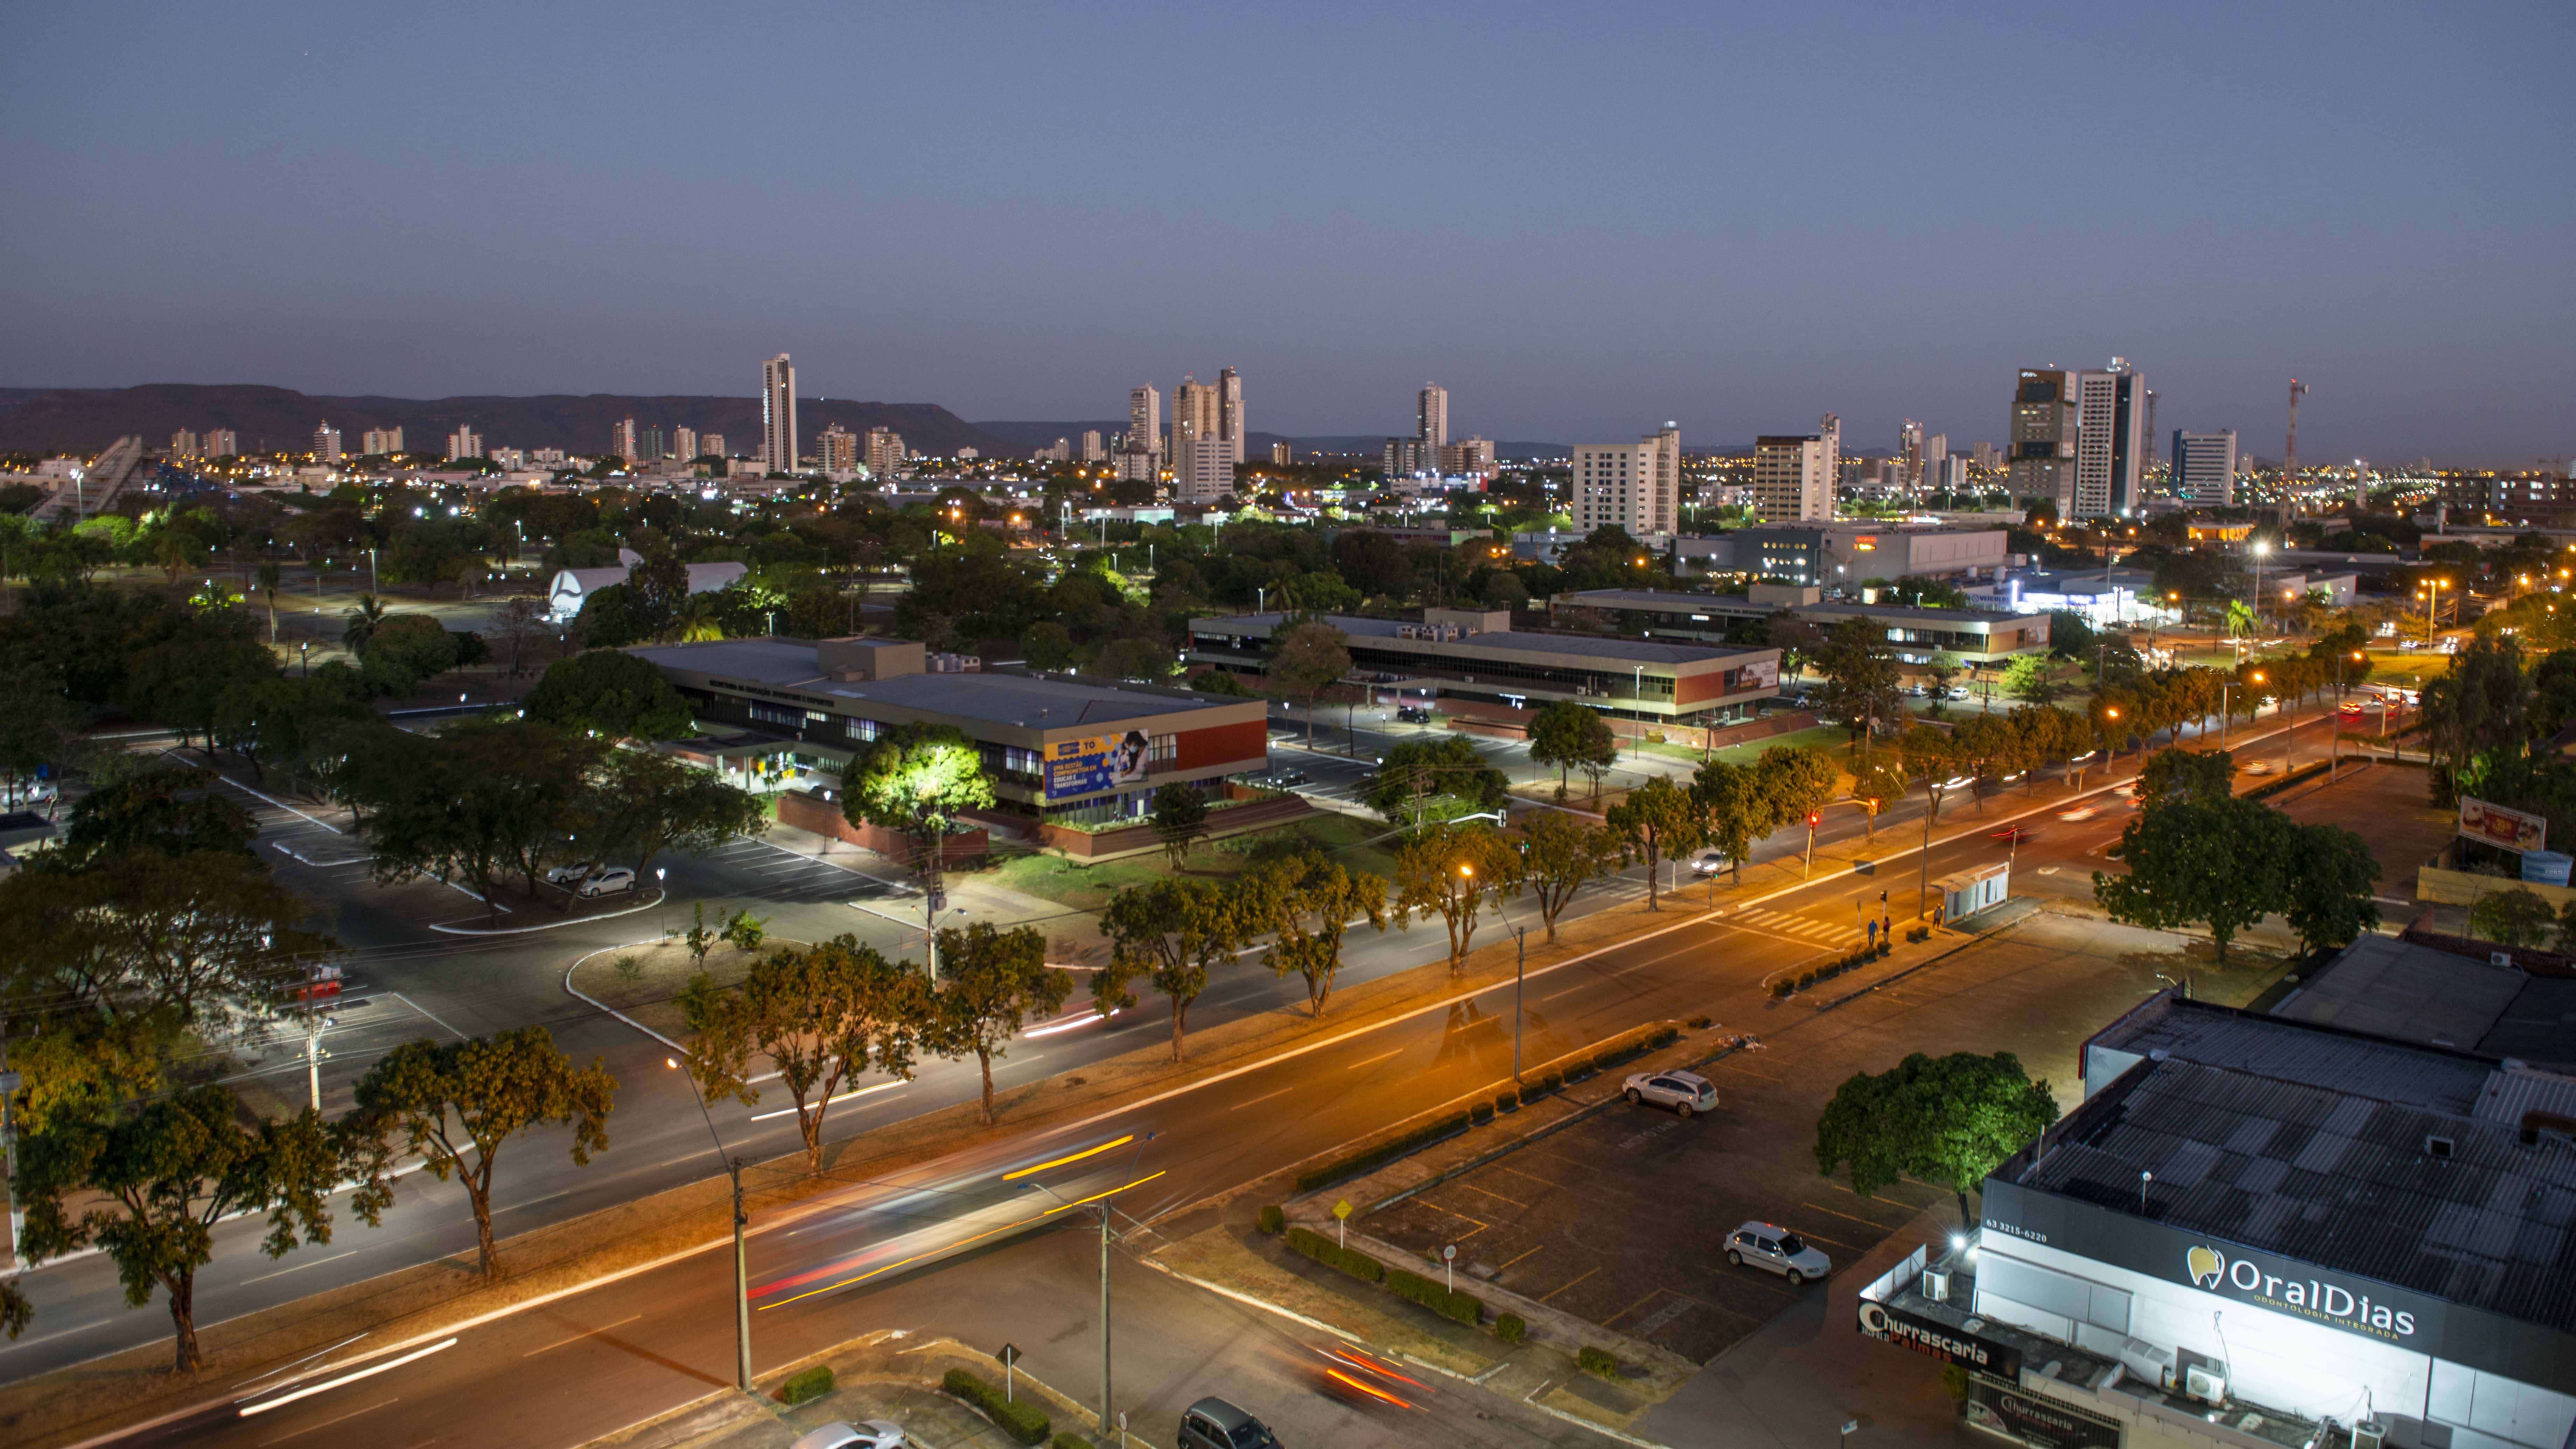
In all the states, except for Amapá, there was an increase in the total of ethnicities, mainly in Amazonas, Bahia and Goiás, in absolute terms. The states with the biggest percentage were Mato Grosso do Sul, Roraima and Tocantins.
The municipalities with the biggest number of ethnicities were São Paulo/SP (194 ethnicities), followed by Manaus/AM (186), Rio de Janeiro/RJ (176) and Salvador/BA (142). In Brasília/DF, 167 ethnicitie were identified. Ou of capitals, the cities with the biggest number of ethnicities were Campinas (SP), with 96 etnias, Santarém (PA), with 87 and Iranduba (AM), with 77. Fernando Damasco, manager of Traditional Territories and protected Areas at the IBGE, attributes the increase of ethnic diversity in average cities to the existence of universities, inlusion policies and Indigenous movements.
“Campinas, Foz do Iguaçu and cities of Mato Grosso do Sul are now hubs that attract the Indigenous population. That has changed the map of diversity in Brazzil in the last decade," Fernando says.
Tikúna is the biggest ethnicity
The Tikúna ethnicity had the biggest number of Indigenous people, with 74,061 people, followed by the Kokama ethnicity, with 64,327 people, and the Makuxí, with 53,446 people. On the other hand, 21 ethnicities, peoples or groups had fewer than 15 people.
The Kokama was one of the main examples of the big increase of quantity between 2010 and 2022. The methodological improvements introduced by the 2022 Census and the processes of identity reaffirmation that have risen in the last few years have made the Kokama the most populous ethnicity in the survey. According to Fernando Damasco, “residents of the Amazonas River region, in the peruvian side, and in the Solimões River, in the Brazilian side, the Kokama are mainly located outside Indigenous Lands recognized and in urban areas. Besides, there is a history of migration in recent decades, mainly from Peru. Recently, they have improved their forms of community organization, claiming access to fundamental rights. With engagement and improvements made in the survey, the portrait of this group was improved.”
The analysis of the 29 most populous ethnicities (with more than 10 thousand people), the highest percentage of persons living in Indigenous Lands belongs to the Yanomami/Yanomán ethnicity, with 94.34% of its population in this situation, followed by the Guajajara, with 80.28% and the Xavante, with 79.5%. The ethnicity with the lowest percentage of residents of an Indigenous Land is the Pankará, with only 0.13%.
2022 Census identifies 295 Indigenous languages; Tikúna is the most spoken one
The Census results show an increase in the number of Indigenous lands spoken or used in the housing unit by Indigenous persons aged two and over. In 2010, there were 274 languages, and, in 2022, 295 languages. The four languages with the biggest number of speakers are: Tikúna (51,978); Guarani Kaiowá (38,658); Guajajara (29,212); and Kaingang (27,482).
Between 2010 and 2022, inside Indigenous Lands, there was an increase in the number of speakers of indigenous languages among persons aged five and over, with a change from 293,853 to 433,980 speakers. Nevertheless, in percentage terms, there was a drop between 2010 (37.35%) and 2022 (28.51%).
“The advance of the Portuguese language in Indigenous Lands stands out among Census results. The main factor is the growing necessity of using the Portuguese language in social life, to work and study, to get around in urban areas, or due to the advance of urbanization in comparison with Indigenous Lands. The absence of specific educatiom policies contribute significantly to this scenario. Historical facts are relevant, for, in many situations, due to racism and discrimination, Indigenous people were forced to stop using their languages in everyday life and use Portuguese instead, which also has an impact on the use in the household. In spite of that, this Census showed that, besides the expansion in the use of Portuguese, there was an increase in the number of speakers of Indigenous languages, either dur to the strengthening of Indigenous languages by means of revitalization acrions and fostering of bilingual education," Fernando Damasco explained.
The Census allowed declaration of up to three Indigenous languages by person, thus revealing regions marked by multilanguages, such as Alto Rio Negro, the North of Pará and Xingu Park. The analysis by age shows that those who speak Indigenous languages exclusively are mostly young, and that can mean a potential for continuity.
“Data show that the transition from the exclusive use of Indigenous languages to the combined use with Portuguese is mainly observed among youngsters, aged 15 and over for men, and aged 20 to 24 for women. This change can be directly related to the start in school, the contact with formal education and the need of the use of Portuguese in workplaces,” Fernando observed.
The distribution of speakers of Indigenous languages also reveals challenges for the exercise of citizenship. “The officialization of Indigenouslanguages is a central demand. Without formal recognition, Indigenous persons face drawbacks in the access to public services, such as the absence of interpreters in schools and city administration. That directly affects the access to citizenship,” Fernando adds.
Illiteracy rate is the highest among indigenous persons that speak only Portuguese
Of the 1.19 million persons aged 15 and over, about 308 thousand are speakers of Indigenous languages. Among these, 78.55% (242 thousand) sare literate, with a litrracy rate below that of the total of Indigenous persons, which was 84.95% in 2022. In comparison with data of 2010, there was a significant decrease of the illiteracy rate: from 32.13% to 21.45%.
Also among Indigneous persons aged 15 and over, those who speak only Indigenous languages have the highest illiteracy rate, 31.85%, followed by those who speak an Indigenous language and Portuguese in the household, 15.45%, and those who spek neither an Indigenous language nor Portuguese in the household, 14.98%. The Indigenous persons who speak only Portuguese have the highest literacy rate, 87.21%.
More than 3 thousand yanomami children lack a birth certificate
Considering the Indigenous population aged up to five, 94.09% have a birth certificate, amounting to 194 thousand children with a certificate issued by a Registry Office (89.12%) or with an Administrative Indigenous Birth Certificate - RANI (4.97%). The percentage of children up to five years of age without a birth certificate was 5.42%, 4.91 p.p. above the comparison with the resident population aged up to five years of age in the country (0.51%), in 2022.
Among ethnicities with the biggest number of children up to five years of age without a birth certificate, among which the Yanomami/Yanomán stand out, with 3,288 children without a birth certificate, corresponding to 65.54%, followed by the Sanumá, belonging to the same ethnic group, with 879 children without a certificate (97.34%), followed by the Makuxí, with 748 children without a birth certificate (7.89%).
Main ethnicities face precarious sanitation conditions
As it is possible that persons of different ethnicities live in the same housing unit, the release of information on sanitation (access to the main form of water supply, sewage disposal and waste collection) is elaborated by residents of households by Indigenous ethnicity, people or group. Another methodological consideration is that the analysis excluded households like "malocas" or housing units without walls, which are arrangements based on their own cultural solutions.
Considering this exception, among ethnicities with the biggest number of residents, in permanent private housing units without access to water supply from a general system, well, source or spring, the Tikúna stand out, with 54,897 residents of this situation, corresponding to 74.21% of the residents in this group, followed by the Guarani-Kaiowá, with 35,011 (70.77%), and the Kokama, with 29,641 (46.26%). The Guajajara, with 73.78%, represent more than 27 thousand persons in this situation; Makuxí, with 51.52%, are more than 26 thousand. In percentage terms, the Yanomami/Yanomán stand out, with 93.07%, or 7,343 persons.
As for sewage disposal, the biggest number of residents who used a rudimentary cesspit, hole, ditch, river, stream or sea or other or without sewarage due to the inexistence of a bathroom or toilet were among the Tikúna, with 68670 residents in this situation, corresponding to 92.82% of the residents in this ethnic group, followed by the Kokama, with 53,197 (83.02%) and Guarani-Kaiowá, with 40,590 (82.05%). The Makuxí, with 72.23%, represent more than 37 thousand Indigenous persons in this situation; the Kaingang, with 81.41%, are 36,941. In percentage terms, the Guajajara stand out, with 91.41%, or 34.152 persons and the Xacriabá, with 90,96%, more than 12 thousand.
As for waste collection, the biggest number of residents without access to direct or indirect waste collection are the Tikúna, with 56,660 residents in this situation, which means 76.59% of the residents in this ethnic group, followed by the Guarani-Kaiowá with 39,837 (80.53%) and the Makuxí, with 36,329 (70.35%). In percentage terms, the highlights are the Guajajara, with 85.66%, about 32 thousand people, and the Xavante, with 81.43%, more than 15 thousand persons.
More about the survey
The Population Census is the most complete statistical operation conducted in the country, and visits all the 5,570 municipalities in Brazil. The publication “2022 Census: Indigenous ethnicities and languages: Main sociodemographic characteristics - Population results” presents statistics on the ethnic and language diversity of the indigenous population, with indicators of sex, age, literacy, birth certificate and access to sanitation, disaggregated by Indigenous ethnicity, people or groups.
The information cover the following geographies: Brazil, Major Regions, Federation Units, Municipalities, Legal Amazon, Legal Amazon by Federation Unit, Indigenous Lands and Indigenous Lands by Federation Unit.