GDP of Municipalities
Municipalities dependent on extractive industry brake economic deconcentration in 2023


December 19, 2025 10h00 AM | Last Updated: December 22, 2025 10h50 AM
Highlights
- In the group of five municipalities with the most intense losses in share in the national GDP between 2022 and 2023, all had an economy related to oil exploration: Maricá (RJ), with a drop of 0.3 percentage points (p.p.), followed by Niterói (RJ) and Saquarema (RJ), with -0.2 p.p. each. Ilhabela (SP) and Campos dos Goytacazes (RJ) complete the list, both with -0.1 p.p.
- This result contributed to the slowdown in the Brazilian economic deconcentration. The share in the national GDP of the 5,543 municipalities that are not capitals fell from 72.5% in 2022 to 71.7% in 2023, while the 27 capital municipalities expanded from 27.5% to 28.3%. The year 2022 marked the lowest participation of capitals.
- On the other hand, the good performance of the services sector encouraged the capitals to increase their share in the GDP in 2023: São Paulo (SP) showed the biggest increase in share (0.4 p.p.), reaching 9.7% of the national GDP, followed by Brasília (DF), Porto Alegre (RS) and Rio de Janeiro (RJ), with increases of 0.1 p.p. each. Belo Horizonte (MG) changed close to 0.1 p.p. and remained among the capitals with the greatest weight.
- Ten municipalities accounted for a quarter of the Brazilian economy in 2023: São Paulo (SP), with 9.7%; Rio de Janeiro (RJ), 3.8%; Brasília (DF), 3.3%; Maricá (RJ), 1.2%; Belo Horizonte (MG), 1.2%; Manaus (AM), 1.2%; Curitiba (PR), 1.1%; Osasco (SP), 1.1%; Porto Alegre (RS), 1.0%; Guarulhos (SP), 0.9%.
- The large urban concentration of São Paulo/SP, which gathers 37 municipalities, increased from 15.8% to 16.2% between 2022 and 2023. In contrast, the large urban concentration of Rio de Janeiro/RJ, which comprises 21 municipalities, was the one that lost the most space, with a drop from 8.7% to 8.0%,
- Large (more than 750 thousand inhabitants) and medium (between 100 thousand and 750 thousand inhabitants) urban clusters showed an economic density 10.2 times higher than the national average in 2023.
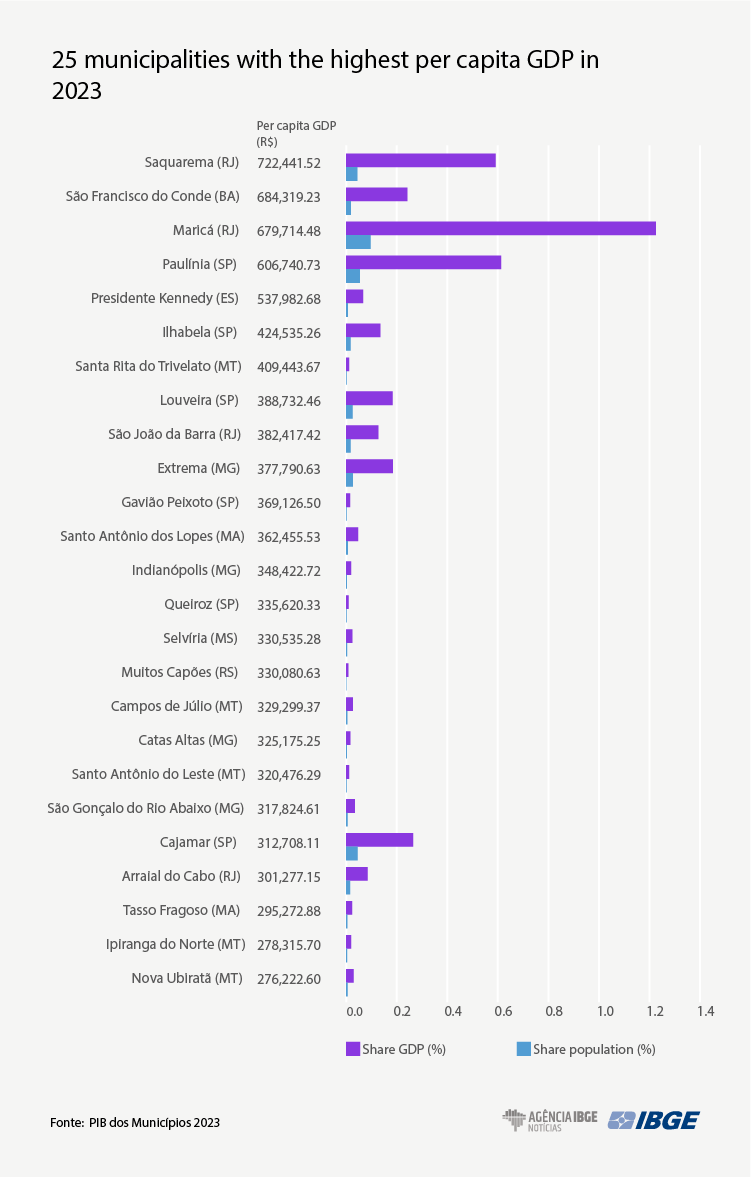
- Saquarema (RJ) led the per capita GDP in 2023, with R$722.4 thousand per inhabitant. Among the capitals, the largest was Brasília (DF), with R$129.8 thousand, which is 2.41 times higher than the national average (R$53.9 thousand).
- Manari (PE) had the lowest per capita GDP in Brazil, with R$7,201.70. Four out of five small municipalities were in Maranhão: Nina Rodrigues (MA), with R$7,701.32; Matões do Norte (MA), with R$ 7,722.89; Cajapió (MA), with R$ 8,079.74; and São João Batista (MA), with R$8,246.12.
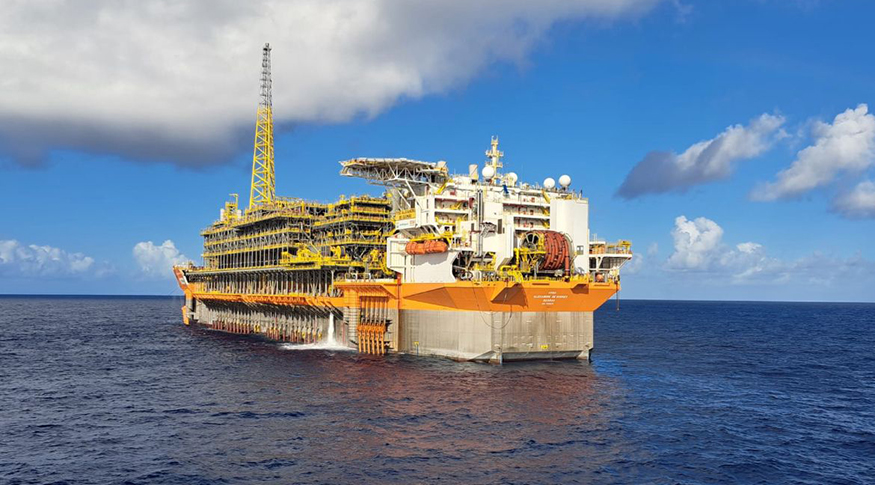
The decline in the prices of oil and iron ore reduced the share in the Gross Domestic Product (GDP) of municipalities more dependent on the mining and quarrying industries in 2023. In the group of five municipalities with the most intense losses, all had an economy related to oil exploration, with emphasis on Maricá (RJ), with a drop in share of 0.3 percentage points (p.p.), followed by Niterói (RJ) and Saquarema (RJ), with -0.2 p.p. each. Ilhabela (SP) and Campos dos Goytacazes (RJ) complete this list, both with -0.1 p.p.
This result contributed to the slowdown in the Brazilian economic deconcentration. The share in the national GDP of the 5,543 municipalities that are not capitals fell from 72.5% in 2022 to 71.7% in 2023, while the 27 capital municipalities expanded from 27.5% to 28.3%. The year 2022 marked the lowest participation of the capitals. In 2002, the beginning of the time series, these indicators were 36.1% for capitals and 63.9% for the other Brazilian municipalities.
The data, released today (19) by the IBGE, are from the GDP of Municipalities 2022-2023. The survey shows information on GDP at market prices and per capita GDP for the 5,570 municipalities. The survey also brings geographic analyses based on typologies and regionalization, which show patterns of concentration and dispersion. The release opening the economic activities was temporarily suspended and will be made available again in 2027, after the publication of the new series of the System of National Accounts base year 2021.
"The 2023 result is linked to specific cyclical issues. The gain in share of capital cities is directly linked to losses in municipalities that are not capitals, mainly linked to oil extraction. This behavior slowed down the process of economic deconcentration," explains the IBGE Regional Accounts analyst, Luiz Antonio de Sá.
He also remembers that more than a third of the Brazilian economy was concentrated in the capitals in 2002. “From then to here, a process of deconcentration occurred that intensified during the pandemic in 2020 and reached its peak in 2022. With the resumption of in-person activities and the end of social isolation, there was a small recovery of this loss of share of capitals in 2023, largely due to the resumption of the services sector,” analyzes Sá.
On the other hand, the good performance of the services sector, especially financial activities, led to gains in the share of state capitals from 2022 to 2023. São Paulo (SP) was the municipality with the biggest increase in share, with an increase of 0.4 p.p., reaching 9.7% of the national GDP. The capital of São Paulo already represented 12.7% of the economy in 2002. In addition to São Paulo, other municipalities with the biggest gains in share in 2023 were Brasília (DF), Porto Alegre (RS) and Rio de Janeiro (RJ), with increases of 0.1 p.p. each. Belo Horizonte (MG) changed close to 0.1 p.p. and remained among the capitals with the greatest contribution.
Share of municipalities in national GDP (%)
| Biggest losses | Biggest gains | |||||||||
|---|---|---|---|---|---|---|---|---|---|---|
| Position | Municipalities | Difference GDP (p.p.) | Share in GDP | Position | Municipalities | Difference GDP (p.p.) | Share in GDP | |||
| 2023-2022 | 2022 | 2023 | 2023-2022 | 2022 | 2023 | |||||
| 1st | Maricá (RJ) | -0.35 | 1.6 | 1.2 | 1st | São Paulo (SP) | 0.36 | 9.4 | 9.7 | |
| 2nd | Niterói (RJ) | -0.18 | 0.9 | 0.7 | 2nd | Brasília (DF) | 0.08 | 3.3 | 3.3 | |
| 3rd | Saquarema (RJ) | -0.16 | 0.7 | 0.6 | 3rd | Porto Alegre (RS) | 0.06 | 0.9 | 1.0 | |
| 4th | Ilhabela (SP) | -0.11 | 0.2 | 0.1 | 4th | Rio de Janeiro (RJ) | 0.05 | 3.8 | 3.8 | |
| 5th | Campos dos Goytacazes (RJ) | -0.10 | 0.5 | 0.4 | 5th | Belo Horizonte (MG) | 0.05 | 1.1 | 1.2 | |
| 6th | Paulínia (SP) | -0.09 | 0.7 | 0.6 | 6th | Manaus (AM) | 0.04 | 1.1 | 1.2 | |
| 7th | Itajaí (SC) | -0.06 | 0.5 | 0.4 | 7th | Campinas (SP) | 0.04 | 0.8 | 0.8 | |
| 8th | Camaçari (BA) | -0.05 | 0.3 | 0.3 | 8th | Goiânia (GO) | 0.03 | 0.7 | 0.7 | |
| 9th | Barueri (SP) | -0.04 | 0.7 | 0.7 | 9th | Cariacica (ES) | 0.03 | 0.1 | 0.2 | |
| 10th | Jundiaí (SP) | -0.04 | 0.6 | 0.6 | 10th | Guarulhos (SP) | 0.03 | 0.9 | 0.9 | |
| 11th | Ipatinga (MG) | -0.03 | 0.2 | 0.2 | 11th | Araruama (RJ) | 0.03 | 0.1 | 0.1 | |
| 12th | Quissamã (RJ) | -0.03 | 0.1 | 0.1 | 12th | São Caetano do Sul (SP) | 0.03 | 0.2 | 0.2 | |
| 13th | Marabá (PA) | -0.03 | 0.1 | 0.1 | 13th | Petrópolis (RJ) | 0.02 | 0.2 | 0.2 | |
| 14th | Cubatão (SP) | -0.03 | 0.3 | 0.3 | 14th | Cajamar (SP) | 0.02 | 0.2 | 0.3 | |
| 15th | São Sebastião (SP) | -0.03 | 0.2 | 0.2 | 15th | Taubaté (SP) | 0.02 | 0.2 | 0.2 | |
| 16th | Santo André (SP) | -0.02 | 0.4 | 0.3 | 16th | Vitória da Conquista (BA) | 0.02 | 0.1 | 0.1 | |
| 17th | Paranaguá (PR) | -0.02 | 0.2 | 0.1 | 17th | Florianópolis (SC) | 0.02 | 0.3 | 0.3 | |
| 18th | Osasco (SP) | -0.02 | 1.1 | 1.1 | 18th | Salvador (BA) | 0.02 | 0.7 | 0.7 | |
| 19th | Horizontina (RS) | -0.02 | 0.0 | 0.0 | 19th | Vitória (ES) | 0.02 | 0.2 | 0.3 | |
| 20th | Canoas (RS) | -0.02 | 0.3 | 0.3 | 20th | Cuiabá (MT) | 0.02 | 0.3 | 0.4 | |
| 21st | Candeias (BA) | -0.02 | 0.1 | 0.1 | 21st | Maceió (AL) | 0.02 | 0.3 | 0.3 | |
| 22nd | Foz do Iguaçu (PR) | -0.02 | 0.2 | 0.2 | 22nd | Santo Antônio dos Lopes (MA) | 0.02 | 0.0 | 0.0 | |
| 23rd | Uberaba (MG) | -0.02 | 0.2 | 0.2 | 23rd | Boa Vista (RR) | 0.02 | 0.2 | 0.2 | |
| 24th | Sorriso (MT) | -0.02 | 0.1 | 0.1 | 24th | Arraial do Cabo (RJ) | 0.02 | 0.1 | 0.1 | |
| 25th | Guaxupé (MG) | -0.02 | 0.0 | 0.0 | 25th | João Pessoa (PB) | 0.02 | 0.2 | 0.3 | |
| 26th | São Desidério (BA) | -0.02 | 0.1 | 0.1 | 26th | Macapá (AP) | 0.01 | 0.2 | 0.2 | |
| 27th | Montenegro (RS) | -0.02 | 0.1 | 0.0 | 27th | Paraty (RJ) | 0.01 | 0.0 | 0.1 | |
| 28th | Catalão (GO) | -0.02 | 0.1 | 0.1 | 28th | Itaguaí (RJ) | 0.01 | 0.1 | 0.1 | |
| 29th | Campo Grande (MS) | -0.02 | 0.4 | 0.4 | 29th | Viana (ES) | 0.01 | 0.0 | 0.1 | |
| 30th | Maracanaú (CE) | -0.02 | 0.1 | 0.1 | 30th | São Carlos (SP) | 0.01 | 0.2 | 0.2 | |
Vitória (ES) and Florianópolis (SC) were the only capitals that did not occupy the first position in the participation ranking in their respective states. In Espírito Santo, Serra occupied the first position, with a share of 17.9%, and Vitória occupied the second position, with 13.5%. In Santa Catarina, Florianópolis occupied the third position, representing 6.1% of the state, behind Joinville (9.7%) and Itajaí (9.4%).
Large urban cluster in São Paulo increases participation in GDP
Of the 185 urban clusters in Brazil, which are areas or municipalities with more than 100 thousand inhabitants, 119 increased their share in the national GDP and 66 lost it, which demonstrates a pause in the deconcentration process in this geography. Among the medium urban clusters, which vary from 100 thousand to 750 thousand inhabitants, the result was also an increase in share for 102 out of 159 medium clusters between 2022 and 2023.
When considering the 26 large urban clusters, areas with more than 750 thousand inhabitants, 17 gained share in the national GDP in the same period of one year. The large urban cluster of São Paulo\/SP, which gathers 37 municipalities, increased from 15.8% to 16.2%, between 2022 and 2023. On the other hand, the large urban cluster of Rio de Janeiro/RJ, which comprises 21 municipalities, was the one that lost the most share, with a drop from 8.7% to 8.0%, due to the oil-producing municipalities included in this cluster, but remains as the second largest GDP in 2023. Among the ten largest urban clusters, the decline in share was from 40.9% in 2022 to 40.7% in 2023.
“It draws attention to the fact that the largest urban cluster, which is São Paulo, was precisely the one with the greatest gain in share in the national GDP of the year, contradicting the trend of GDP deconcentration in the time series. The recovery in share of São Paulo and other geographies that include the capital and municipalities in the metropolitan area are explained by the relative gain in services activities, which had been showing a loss of participation since the beginning of the time series, with an intensified loss in 2020 and 2021, due to the economic effects of the pandemic,” explains the IBGE Regional Accounts analyst.
Also notable for increasing share were the large urban clusters of Vitória/ES and Brasília/DF, reaching 1.0% and 3.5% in 2023, respectively. The medium urban cluster with the greatest relative gain was Araruama/RJ, which went from 0.10% in 2022 to 0.13% in 2023. Also noteworthy are the medium urban clusters of Caraguatatuba - Ubatuba - São Sebastião/SP and Campos dos Goytacazes/RJ, as the second and third areas with the greatest loss of participation in the period.
When observing some specific geographies, it appears that the city-area of São Paulo, which concentrates 92 municipalities, had a gain in share, going from 23.3% in 2022 to 23.5% in 2023. Likewise, the Semiarid region saw its share increase from 6.2% to 6.3%, while the Legal Amazon had its share maintained at 9.5%.
Almost a quarter of the economy is concentrated in 10 municipalities
Ten municipalities accounted for approximately a quarter (24.5%) of the Brazilian economy in 2023: São Paulo (SP), with 9.7%, Rio de Janeiro (RJ), 3.8%, Brasília (DF), 3.3%; Maricá (RJ), 1.2%; Belo Horizonte (MG), 1.2%; Manaus (AM), 1.2%; Curitiba (PR), 1.1%; Osasco (SP), 1.1%; Porto Alegre (RS), 1.0%; and Guarulhos (SP), 0.9%. In 2002, only São Paulo (SP), Rio de Janeiro (RJ), Brasília (DF) and Belo Horizonte (MG) represented this same proportion of the GDP.
In terms of position, in the comparison between 2002 and 2023, Maricá (RJ), rose from 354th to fourth position, Manaus (AM), from seventh to sixth; Osasco (SP), from 16th position to eighth, and Guarulhos (SP), from 14th to 10th. On the other hand, Belo Horizonte (MG) moved from fourth to fifth; Curitiba (PR), from fifth to seventh and Porto Alegre (RS), from sixth to ninth.
Large and medium-sized urban clusters have an economic density 10.2 times greater than the national average
The analysis of the GDP according to economic density, that is, weighted by area, also reveals an oscillation in spatial concentration. The economic density in Brazil, in 2023, was 1,288 thousand R$/km². In turn, large and medium-sized urban clusters showed a density of 13,179 thousand R$/km², that is, around 10.2 times higher than the average for the national territory. This value shows a very accentuated spatial concentration, although, in relation to 2022, this result has fluctuated by 0.1 percentage point downwards.
“The difference between the economic density of urban clusters and the Brazilian territory reduced throughout the time series, which was reinforced in 2023 due to the loss of share of medium urban clusters in the GDP, compared to 2022,” explains Sá.
Eight out of ten municipalities with the highest economic densities in Brazil were in the city-area of São Paulo, including the first six positions, with emphasis on Osasco (SP), with more than 1.8 billion R$/km². Furthermore, among urban clusters, spatial inequality, although smaller, is still notable. While in the urban cluster of São Paulo the density was 247,402 thousand R$/km², in Rio de Janeiro, second in the classification, the value was 144,799 thousand R$/km², that is, 58.5% of the value observed in São Paulo\/SP. It is also noteworthy that seven out of ten urban clusters with the highest economic density were in the state of São Paulo.
| 10 highest GDPs and economic densities in Brazil, according to Municipalities and Urban Clusters 2023 | ||||
|---|---|---|---|---|
| Municipalities | ||||
| 10 largest municipalities by GDP value | GDP (R$ 1 000) |
Share of GDP in Brazil (%) | 10 Municipalities with greater economic density | Economic density (thousand R$/km2) |
| Total | 2 684 666 348 | 24.5 | Total | 676 253 |
| São Paulo (SP) | 1 066 825 105 | 9.7 | Osasco (SP) | 1 838 286 |
| Rio de Janeiro (RJ) | 418 462 360 | 3.8 | São Caetano do Sul (SP) | 1 471 101 |
| Brasília (DF) | 365 669 108 | 3.3 | Barueri (SP) | 1 090 496 |
| Maricá (RJ) | 134 092 034 | 1.2 | São Paulo (SP) | 701 304 |
| Belo Horizonte (MG) | 130 197 671 | 1.2 | Diadema (SP) | 690 781 |
| Manaus (AM) | 127 649 795 | 1.2 | Taboão da Serra (SP) | 592 710 |
| Curitiba (PR) | 120 065 276 | 1.1 | Niterói (RJ) | 570 198 |
| Osasco (SP) | 119 404 053 | 1.1 | Paulínia (SP) | 483 274 |
| Porto Alegre (RS) | 104 743 272 | 1.0 | Mauá (SP) | 403 648 |
| Guarulhos (SP) | 97 557 674 | 0.9 | Belo Horizonte (MG) | 392 926 |
| Urban Clusters | ||||
| 10 largest Urban Clusters by GDP value | GDP (R$ 1 000) |
Share of GDP in Brazil (%) | 10 Urban Clusters with greater economic density | Economic density (thousand R$/km2) |
| Total | 4 455 151 347 | 40.7 | Total | 150 857 |
| São Paulo/SP | 1 769 904 919 | 16.2 | São Paulo/SP | 247 402 |
| Rio de Janeiro/RJ | 875 278 419 | 8.0 | Rio de Janeiro/RJ | 144 799 |
| Brasília/DF | 385 267 743 | 3.5 | Campinas/SP | 131 621 |
| Belo Horizonte/MG | 284 103 179 | 2.6 | Indaiatuba/SP | 90 725 |
| Porto Alegre/RS | 236 663 387 | 2.2 | Jundiaí/SP | 90 432 |
| Campinas/SP | 233 488 774 | 2.1 | Itajaí - Balneário Camboriú/SC | 77 434 |
| Curitiba/PR | 232 529 710 | 2.1 | Americana - Santa Bárbara d´Oeste/SP | 71 059 |
| Salvador/BA | 159 580 421 | 1.5 | Vitória/ES | 64 529 |
| Recife/PE | 150 685 001 | 1.4 | Baixada Santista/SP | 58 111 |
| Manaus/AM | 127 649 795 | 1.2 | Sorocaba/SP | 57 320 |
| Source: IBGE, in partnership with the State Statistical Offices, State Government Secretariats and Superintendency of the Manaus Free Trade Zone - SUFRAMA. Note: Typologies and regionalization under the responsibility of the IBGE´s Division of Environment of the Directorate of Geosciences. |
||||
Saquarema leads the ranking and urban centers lose relative strength in per capita GDP
In 2023, the ten Brazilian municipalities with the highest per capita GDP concentrated just 0.3% of the population, but accounted for 3.4% of the national GDP. Saquarema (RJ) led the ranking, with R$722.4 thousand per inhabitant, driven by oil and gas extraction, an activity that also supported the performance of Maricá (RJ), Presidente Kennedy (ES), Ilhabela (SP) and São João da Barra (RJ). The national average was R$53.9 thousand.
São Francisco do Conde (BA) and Paulínia (SP) stood out for oil refining, occupying the second and fourth positions. In contrast, Santa Rita do Trivelato (MT) reached seventh place thanks to the strong production of soybeans and cotton, while Louveira (SP) and Extrema (MG) were among the top ten driven by trade and the manufacturing industry.
On the other hand, four out of five lowest per capita GDP in Brazil are in Maranhão. Manari (PE) recorded the lowest value, R$ 7,201.70. Next comes Nina Rodrigues (MA), with R$ 7,701.32; Matões do Norte (MA), with R$ 7,722.89; Cajapió (MA), with R$ 8,079.74; and São João Batista (MA), with R$8,246.12.
Among the capitals, Brasília (DF) showed the highest per capita GDP (R$ 129.8 thousand), a value 2.41 times higher than the national average of R$ 53.9 thousand. Belém (PA) had the lowest performance among the capitals (R$ 31.1 thousand), with a ratio of 0.58. In history, seven capitals — concentrated mainly in the Southeast and South, in addition to Brasília R$ 129,790.44) and Manaus (R$ 61,855.15) — maintained values above the national average.
The municipalities with the highest per capita GDP are concentrated in the large urban centers of the Center-South and in agricultural areas with low population density, especially in the center of Mato Grosso, south of Goiás, west of Bahia and upper Parnaíba. Among the large urban clusters, Campinas/SP (R$ 111,550.70) led in 2023, followed by Brasília/DF (R$ 99,842.37), São Paulo/SP (R$ 85,613.16), São José dos Campos/SP (R$ 79,272.39) and Sorocaba/SP (R$ 76,018.17).