National industry
Industrial output falls 0.7% in August, third drop in a row


October 05, 2021 09h00 AM | Last Updated: October 05, 2021 05h00 PM
Having retreated 0.7% between July and August, the industrial output dropped for the third month in a row. The cumulative loss was 2.3% in this period. With the August´s result, the industry stands 2.9% below the level of February last year, in the pre-pandemic scenario, and 19.1% below the record level, registered in May 2011. The data are from the Monthly Survey of Industry - PIM, released today (5) by the IBGE. The sector accumulated a gain of 9.2% in the year and of 7.2% over the last 12 months.
The drop recorded in August was spread along three out of four major economic categories and along the majority (15) of the 26 sectors surveyed by PIM. André Macedo, manager of the survey, highlights that the results keep on reflecting the effects of the Covid-19 pandemic. “There is a derangement in the production chain, increasing the production costs and running out of raw material to manufacture final goods. On the supply side, it has been bringing more difficulty to the advance of the sector,” says him.
The researcher complements that other aspects linked with the domestic demand are coupled with those difficulties faced by the industry. “There is a significant contingent of workers out of the labor market and the new positions have smaller wages, i.e., job conditions are precarious. There is also a retraction in the wage bill and smaller income available to the households, due to the higher inflation. These factors affect the acquisition conditions of households,” states Macedo.
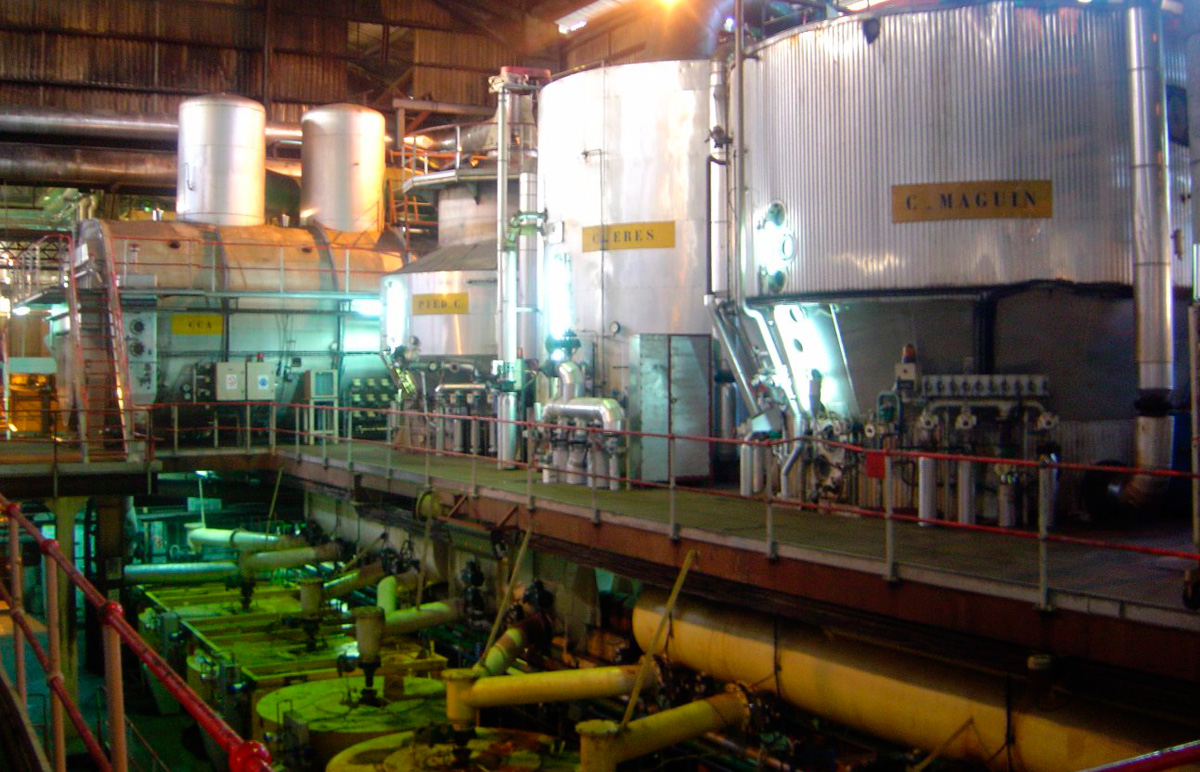
The drop in August was mainly leveraged by other chemicals (-6.4%), coke, petroleum products and biofuels (-2.6%), motor vehicles, trailers and bodies (-3.1%) and pharm-chemicals and pharmaceuticals (-9.3%). “The sector of other chemicals has already been dropping over the two previous months, due to the shut down in producing units. On the other hand, the sector of petroleum derivatives grew in the three previous months, mostly related to the relaxation in the health restrictions, which allowed people more mobility. The drop in this activity in August represents an adaptation, a punctual drop rather than a reversion of a positive behavior,” analyzes him.
Other activities that negatively impacted on the overall index were computer equipment, electronic and optical products (-4.2%), electrical machines, devices and material (-2.0%), rubber and plastic products (-1.1%), manufacture of wearing apparel and accessories (-1.6%) and pulp, paper and paper products (-0.8%).
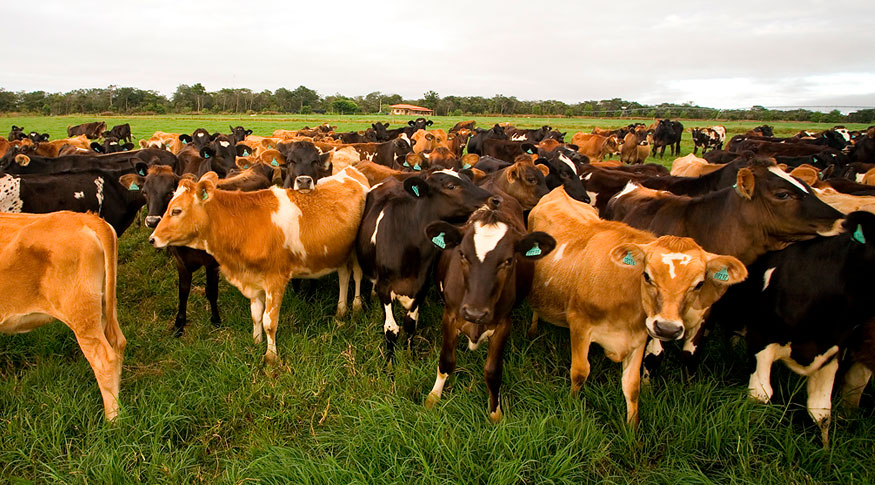
Among the products that grew their output, food products (2.1%), beverages (7.6%) and mining and quarrying industries (1.3% stood out. “These three activities registered a predominantly negative behavior in the previous months. The positive figure in August is more a recomposition of those previous losses than a positive trend that these industrial segments may have,” states Macedo. Basic metals (1.1%), wood products (3.0%) and textiles (2.1%) also grew in August.
Having retreated 3.4%, the category of durable consumer goods recorded the eighth consecutive month of reduction, accumulating a drop of 25.5% in the period. Capital goods (-0.8%) and intermediate goods (-0.6%) also dropped in August. The only major economic category that increased in this comparison was that of semi and non-durable consumer goods (0.7%), which stepped up the growth of July (0.5%).
Industry declines 0.7% over August 2020
The industrial output also retreated 0.7% compared with August last year. This result interrupted 11 months of growth. The retraction was spread along three out of four economic categories and 14 out of 26 sectors surveyed. “The comparison bases of the previous months were quite depreciated. It even explains two-digit growth rates. However, the comparison basis increases as the months advance. At the same time, the output in 2021 grows at a lower pace, showing less intensity. It explains the first negative figure after 11 months of increasing output,” says the manager of the survey.
Among the major impacts for the negative figure are food products (-7.4%) and coke, petroleum products and biofuels (-5.2%). Other activities that dropped were rubber and plastic products (-6.6%), beverages (-6.4%), computer equipment, electronic and optical products (-10.1%), other chemicals (-3.4%), mining and quarrying industries (-1.6%), tobacco products (-23.3%), furniture (-12.9%) and fabricated metal products (-3.4%).
Among the activities that registered positive results in this indicator, machinery and equipment (23.7%) and basic metals (20.0%) were those that mostly impacted the overall index. Other positive figures came from the sectors of motor vehicles, trailers and bodies (3.6%), non-metallic mineral products (5.6%), manufacture of wearing apparel and accessories (8.5%), printing and reproduction of recorded media (39.1%), leather, traveling goods and footwear (8.5%), wood products (9.8%) and other transportation equipment (13.7%).
More on the survey
PIM Brazil has been producing short-term indicators since the 1970s regarding the behavior of the real product of the mining and quarrying and manufacturing industries. From May 2014, the release of a new series of monthly industrial production indices began, after a reformulation to: update the sample of activities, products and respondents; prepare a new weighting structure for the indices based on the most recent industrial statistics, in order to harmonize with the needs of the implementation the National Accounts Series - reference 2010; and to adopt the new classification of activities and products used by other industry surveys from 2007 onwards, namely: the National Classification of Economic Activities - CNAE 2.0 and the List of Industrial Products - PRODLIST-Industry.
The survey results can also be consulted in the Sidra database.