Summary of Social Indicators
Larger municipalities implemented most policies to combat Covid in 2020


December 02, 2022 10h00 AM | Last Updated: December 06, 2022 03h52 PM
Highlights
- The percentage of food secure housing units fell from 65.1%, in 2004 (PNAD), to 63.3% in 2018 (POF) and to 41.3% in 2021 (VigiSAN).
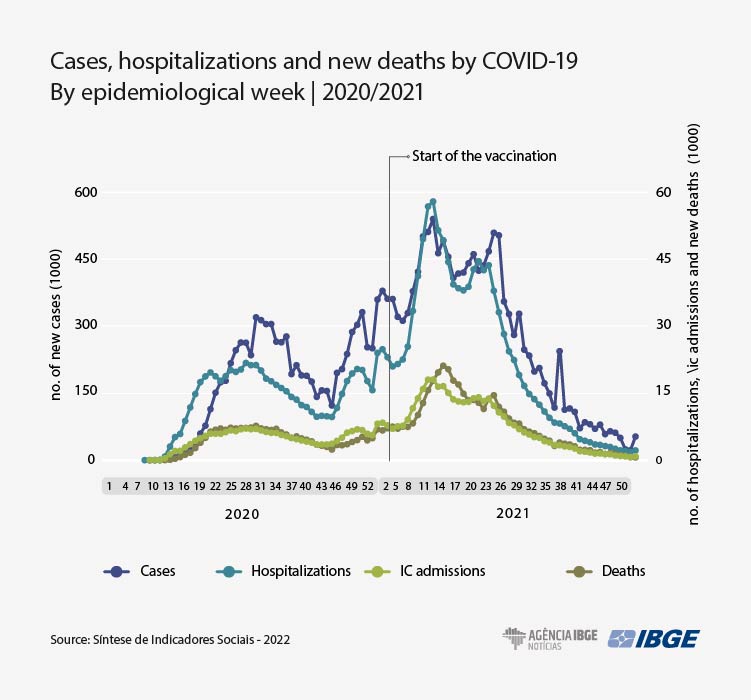
- In 2020 and 2021, in Brazil there were 22.3 million cases of COVID-19 and more than 600 deaths caused by the disease. A total of 7.7 million cases and approximately 200 thousand deaths were registered in 2020 and 14.6 million cases and 420 deaths in 2021.
- The highest case-fatality rate (7.0%) was observed in the 18th epidemiological week in 2020 (from April 26 to May 2). The rate was stable at 2.9% from the 32nd wee on August 8-14) in 2021, when vaccine coverage of the first dose had reached 55% of the population.
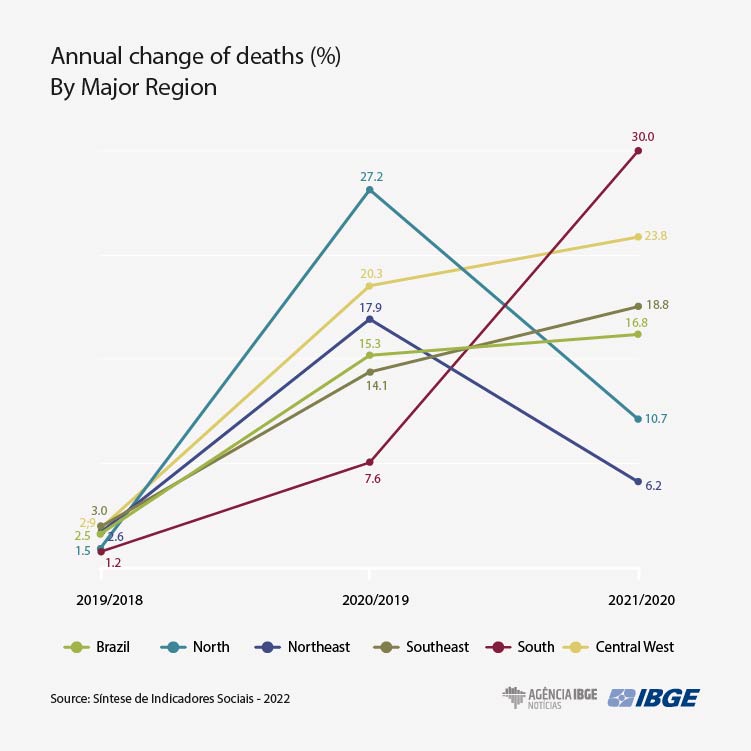
- From 2010 to 2019, before th pandemic, the average annual increase in the total deaths in the country was 1.1%. In 2020, this rate jumped to 15.3%, and in 2021, to 16.9%.
- In 2021, the highest incidence of deaths caused by COVID-19 was among white men (30.8%), followed by white women (25.3%), black or brown men (22.8%) and black or brown women (17.8%).
- The number of beds in facilities of the Unified Health System (SUS) fell from 2010 to 2021, with a change from 1.73 to 1.47 em 2021, and the lowest figure being registered in 2019 (1.42 beds). The number of beds non-SUS beds per 1,00 health insurance beneficiaries was 8.93 in 2010 and reached 4.86 beds in 2021.
- There was a significant increase in the number of health appointments between 2010 (291 thousand) and 2021 (449 thousand). Services out of SUS increased 79% in the period, whereas SUS appointments did by 47%. Therefore, the participation of SUS-base dappointments in the national total decreased from 76.1% to 72.3%, in the same period, and remained as the main form of access by the population to healthcare services.

Food securiy, an indicator directly related to the populations health status, fell from 65.1%, in 2004, according to the IBGE’s National Household Sampe Survey, to 41.3% in 2021, according to the National Inquiry on Food Insecurity in the context of the Covid-19 Pandemic in Brazil (VigiSAN). According to the IBGE Consumer Expenditure Survey, decrease was observed from 2018 on, when the proportion of food secure housing units fell to 63.3%. These data can be found in the Summary of Social Indicators, released today by the IBGE.
According to PNAD data, food security increase between 2004 and 2013, and changed from 65.1% of the housing units, in 2004, to 77.4%, in 2013. But the Consumer Expenditure Survey 2017-2018 showed that this scenario was reversed, also considering the increase in the proportion of housing units facing mild food security, from 22.6% to 36.7%. “That is, in the beginning of the COVID-19 pandemic, food security in Brazilian housing units had increased in immediately previous year,” says Clician do Couto, IBGE analyst.
In 2020, according to dta from the National Inquiry on Food Insecurity in the context of the Covid-19 Pandemic in Brazil – VigiSAN, the proportion of food secure housing units was 20.5%, being severe in 9% and moderate in 11.5%. In 2021, although mild food insecurity has decreased from 2020, from 34.7% to 28.0%, the proportion of housing units with moderate housing units went from 15.2% to 15.5%. And the proportion of food secure housing units fell from 44.8% to 41.3%.
2021 had more deaths by COVID-19, but case-fatality rate was lower
In 2020 and 2021, Brazil had 22.3 million cases of COVID-19 and 633 thousand deaths. The year 2021 registered the biggest number of cases and deaths (respectively 14.6 million and 420.3 thousand) than year 2020 (7.7 million and 212.7 thouasnd), according to data from the Brazil Mortality Information System, of the Ministry of Health. Nevertheless, case fatality for the disease (percentage of deaths of individuals diagnosed with COVID-19) was highest in 2020.
““In 2020, the disease was not known, nor which type of medication to use against it, there was no information about protocols and no vaccine. In 2021, case-fatality rose, but got stable with the expansion of vaccination coverage. There was high incidence of the disease in the year, but, despite the bigger number of infections, case-fatality was low.”
The highest case-fatality rate was observed in the 18th epidemiological week (SE) in 2020, between April 26 and May 2, when it reached 7.0%. In 2021, case-fatality started a t 1.9% and reached 3.0% until the 17th SE (April 25 to May 01), when it got stable. From the 32nd week on (August 08 to 14), when vaccination coverage neared 55% of the population, the rate reached 2.9%, having remained at that level until the end of 2021.
In 2021, highest incidence of deaths caused by Covid-19 was registered among white men
Summary of Social Indicators 2021 also showed the evolution of mortality, thus making it possibl to measure the impact of the pandemic on the population’s health. From 2010 to 2019, a period prior to the pandemic, the average annual increase of deaths was 1.1%; there was an increase of 15.3% in 2020 and of 16.9% in 2021. In 2020, there were 1.1 million deathd in Brazil and, in 2021, 1.8 million, an increase of 59.9%. Mortality, in turn, increased by 46.6% from 2010 to 2021, with a change from 5.8 to 8.5 per each 1,000 residents.
“Demographic indicators are usually stable, with very few changes in two years. So, the changes in mortality observed in 2020 and 2021 represent a major impact.”
The analysis of mortality due to Covid-19 shows an increase of 97.6% in deaths between 2020 and 2021, with a change from 212.7 thousand to 420.3 thousand. The most affected groups in 2020 were black or brown men (27.5%) and white men (27.2%), followed by white women (21.5%) and black or brown women (19.6%). In 2021, this distribution was changed: white men were the majority (30.8%), followed by white women (25.3%), black or brown persons (22.8%) and black or brown women (17.8%)..
According to Clician do Couto, this change may have been influenced by policies aimed at the combat to pandemics, implemented in the Northeast Region, where there is a predominance of the black and brown population and bigger population density in urban areas. The researcher explains that, from 2020 to 2021, there was acceleration of increase of deaths in the South, Southeast and Central West and deceleration in the North and Northeast.
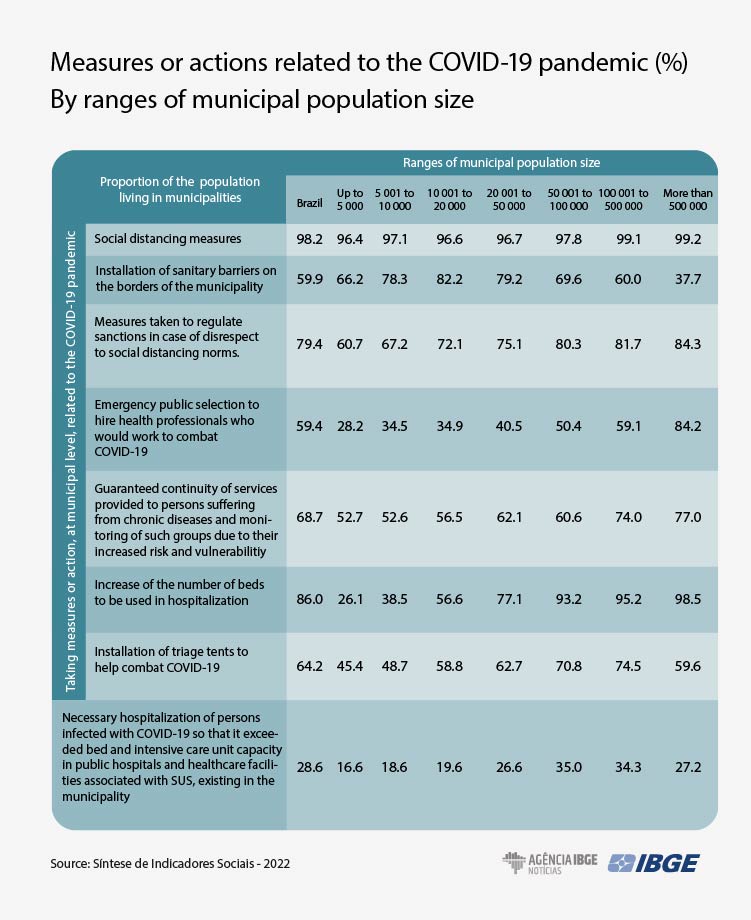
Larger municipalities implemented most policies to combat Covid 2020
In relation to policies adopted by municipalities to face Covid, it was observed that the population size affected indicators of policies related to COVID-19. In 2020, larger municipalities imposed more sanctions against disrespect to social distancing measures, hired heathcare professionals, promoted the continuity of care for chronical diseases and increased the number of hospitalization beds. .
“At the same time, the largest ones also reported having exceeded the limit capacity of hospitalization beds and UTO care, which is related, among other factors, to the fact that many small municipalities had no proper infrastructure and had to tranfer patients to other cities,”, Leonardo Athias, IBGE analyst, explains.
From 2010 to 2021, number of hospitalization beds drops
The analysis of the number of beds in SUS per each 1,000 residents and the number of non-SUS beds per 1,000 health insurance beneficiaries, there was a decreaase in both indicators from 2010 to 2021, with a change from 1.73 SUS-beds in 2010 to 1.47 in 2021, with the same value observed in (1.42 leito). The rate of non-SUS beds was 8.93 in 2010 and reached 4.86 beds in 2021.
The number of complementary SUS beds per 1000 residents recorded little change between 2010 and 2019, having changed from 0.12 to 0.15. In 2020, the number of deaths per 1,000 residents increased from 0.19, in 2020, to 0.27, in 2021 and that was related to the combat against the COVID-19 pandemic.
On the other hand, the number of non-SUS complementary beds per 1,000 health insurance beneficiaries fell from 1.40 to 1.14 between 2010 and 2019, and ihcreased again in 2020 (1.53) and in 2021 (1.56), exceeding the start of the series.
Extra regular beds and hospitalization beds were creatd in 2020 and 2021 as a support during the pandemic and with more strict criteria, such as field hospitals and other adpted structures, but, since the middle of 2021, the number of beds started to fall.” Between January 2019 (58.4 thousand) and July 2022 (76.9 thousand), the biggest number was registered in July 2021, with 105.7 thousand extra beds.
SUS appointments fall in participation between 2010 and 2021
As for medical appointments, there was a significant increase in absolute terms between 2010 and 2021, from 291 thousand to 449 thousand, especially because of non-SUS appointments, which increased 79% in the period, above those by SUS, which increased 47%. So, the proportion of SUS appointments in the total fell from 76.1% to 72.3%. The biggest proportion of SUS appointments, in 2021, were those of Family doctor (98.8%) and General practioner (79.2%), whereas the smallest were those of Ginecologist– Obstetrician (59.3%) and Radiologist (60.5%).