Education
IBGE delivers workshop in the third edition of the course “Public policies in the digital area: Mastering IBGE data”


March 19, 2024 05h35 PM | Last Updated: March 22, 2024 01h57 AM
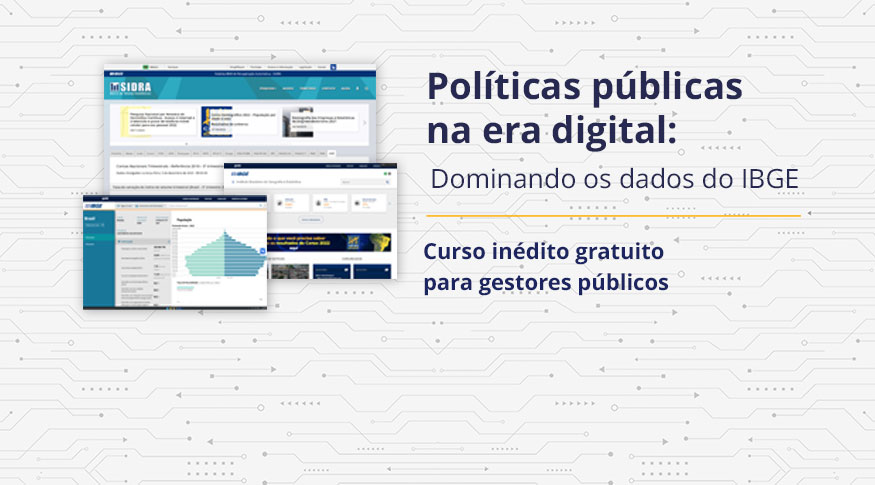
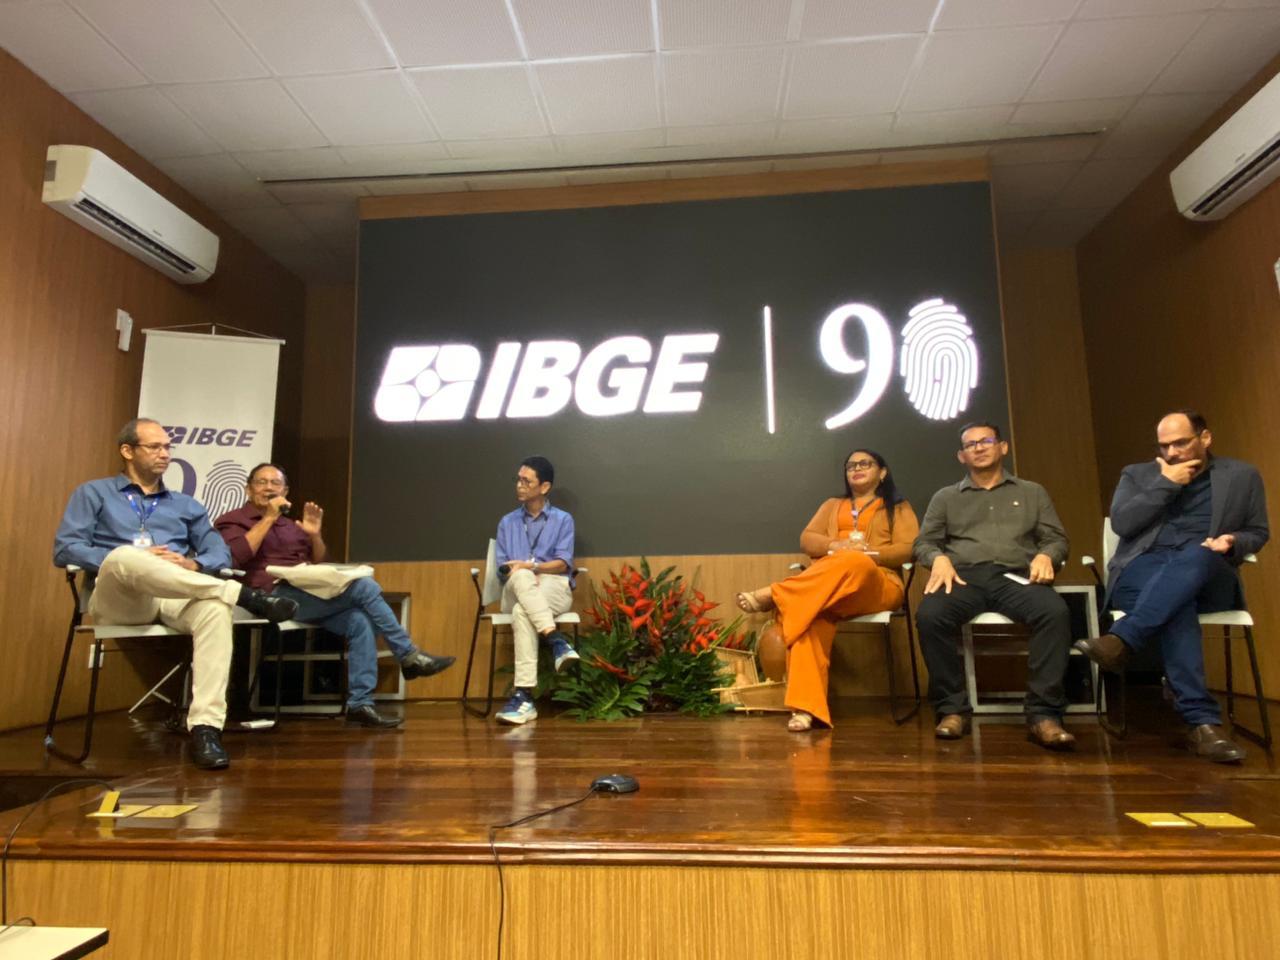
The IBGE introduced yesterday (18), the third class of the workshop entitled “Public policies in the digital area: Mastering IBGE data”, broadcast online, via Webex, to more than 200 participants. The course is aimed at municipal and state managers with the objective of training them in the use of the IBGE System of Automatic Retrieval (SIDRA) and it is administered by the IBGE’s National School of Statistical Sciences (ENCE).
The director of the National School of Statistical Sciences (ENCE/IBGE), Paulo Jannuzzi, the coordinator of the Center for Information Dissemination and Documentation (CDDI/CCS), Daniel Castro, the director of Technology and (DTI), Marcos Mazzoni, and the analysts Felipe Barreiro, Renata Corrêa and Vinicius Ferreira, besides the technologist Rodrigo Almeida, were in charge of the course.
“This workshop you are attending is important not only to learn about the tools the IBGE works with, such as SIDRA, but also for you to understand how they can be used by society. This course will help you understand this process within the public segment and how these tools provided by the Institute can be used, not only as a way to face the risks in the digital area, but as a way of enjoying the opportunities brought by this segment,” said Mr. Casto, as he welcomed the participants.
Paulo Jannuzzi, director of ENCE, mentioned the role of the transmission of information by the IBGE in order to foster public policies, “We intend to have one more channel for the dissemination of data regularly produced by the IBGE by society, by public managers, by companies and by users in general. Public policies demand a lot of information to be successfully implemented. So these are the objectives of this workshop, to allow you to learn more about our collection of information and help managers understand better the necessities of public policies.
Marcos Manzoni was the next one to speak and he explained the transformation in the use of technology by society, and called attention to its role in the public sector. “We are having new opportunities and facing new threats. At first technology was used in the calculation of calculations of massive volume, in services such as paychecks and accounting. Now we have a more encompassing view of technology with reference to citizenship. Nowadays what exists is not a user navigating a system, but systems navigating around a citizen.” He also highlighted the mission of this course. “Our objective is to create a network, making available cooperation environments, where, together, we can build a stronger society that can use resources to the fullest, the director concluded.
Following the opening remarks by the directors, the analysts introduced to those participants the functions of the IBGE Portal and all its respective channels. A planning analyst from the Coordination of Experience and Online Services (CDDI/CEON), Felipe Barreiro, showed to the audience the tools of the Institute's portal such as access to indicators by state, news agency and published announcements. "This workshop is primarily for the lay audience, we will demonstrate that some data that you used to pay for, now can be obtained for free. Many people wonder what the IBGE is, which is an institute that is the country's main source of geoscientific data. And our mission is to portray Brazil with the necessary information for understanding its reality and exercising citizenship", said Felipe Barreiro.
Next, Rodrigo Almeida, a technologist from CDDI/CEON, presented the features of the Cities Channel, which organizes the IBGE information by state and municipality. "We can make comparisons with other municipalities and states. Here we see the column of Rio de Janeiro, but we can compare with São Paulo data, such as population, number of marriages and live births", explained Mr. Almeida. Within the platform, it is possible to observe the ranking position of those cities and states as for each available data, such as civil registrations. Using data provided by the UN, the Countries website is used to make comparisons with other countries, such as Mexico and India, making it possible to see a synthesis of data on each country and the ranking of economic, population, social and environmental data.
He also presented the Overview website, which gathers data from each region, illustrated with age pyramids, numbers regarding color and race, and graphics representing the population and gender division, for example, as well as interactive maps. Another platform presented was Names, with data regarding the most used names in the country according to the 2010 Census, by city and state.
Rodrigo Almeida also provided an overview of the IBGE Library and of the IBGE Store, products that allow locating surveys produced by the Institute and books for sale, respectively, and the Service Channels, where users can ask questions about any data produced by the Institute.
Renata Corrêa, analyst from the Marketing Department (CDDI/COMAR), explained the emergence of IBGEeduca, a platform for the transmission of information in a way that reaches the younger audience. "We have a very large volume of information compared to the past generations, but we do not have quality control. Young people today share a lot of information and some even create content, and the IBGE has a very important role in disseminating this data. For this, IBGEeduca was created, the Institute’s portal focused on education with playful and updated content, aimed at children, young people and also teachers”, said Renata. The analyst also presented some products within the platform. "We have a play section, focused on games and narratives with characters told through comics. One of the games is the Independence Challenge, held in celebration of the 200 years of September 7th", explained Renata.
In addition to interactive maps and comics, IBGEeduca also presents special articles, with a language appropriate for its target audience, as well as support material. Renata Corrêa also presented some awareness-raising activities such as those carried out in the 2022 Census with the quilombola and indigenous populations, by means of the creation of characters and videos. "A country that knows itself has a lot to gain", concluded the analyst.
At the end of the workshop, Vinícius Pereira, an analyst from DTI, presented the tools of SIDRA, a system that allows users to access data from surveys conducted by the IBGE, and to visualizing them as charts, graphs, and cartograms. "All data are organized into a certain structure and this structure is presented in a survey", explained Mr. Pereira. To exemplify, the analyst used the Continuous PNAD, a survey that produces indicators to monitor the quarterly fluctuations and the evolution of workforce. "Although there is information here, not all of it is here. SIDRA is a summarized version of data presentation", concluded the analyst. The system contains information such as methodology, topics, information units and reference periods related to each survey.
"The tables are organized considering that users cannot access all the data. Some spreadsheets aggregate up to 50 million data", said Vinícius Pereira, who also taught managers the process for receiving notifications at the time of publication of these data in SIDRA.
"We have different types of users of SIDRA, from high school students to public managers. Therefore, data always appears in a summarized form. The IBGE also values punctuality, publishing data on time, because they are important to the country", Mr. Pereira concluded.