2022 Census
2022 Census: 94.6% of the quilombolas living in rural localities face poor sanitation


May 09, 2025 10h00 AM | Last Updated: May 13, 2025 11h43 AM
Highlights
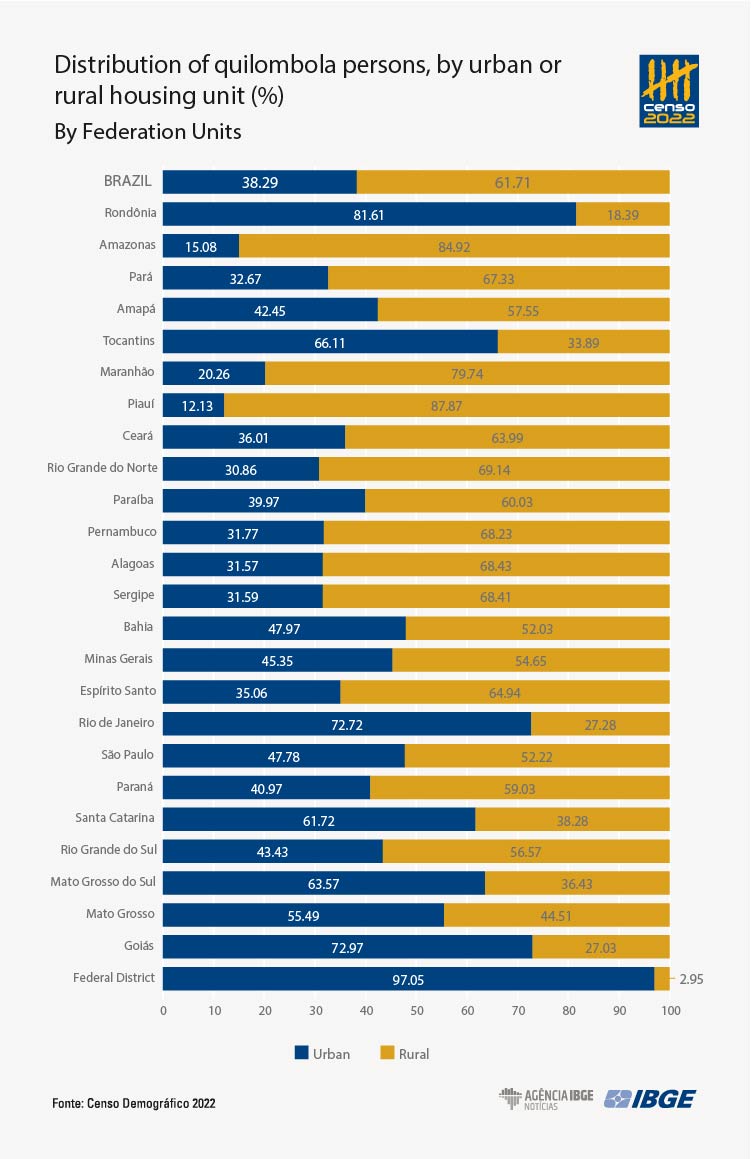
- Of the total quilombola population (1,330,186 persons), 38.29% live in urban localities and 61.7% in rural localities. In delimited Quilombola Territories, 12.63% of the residents live in urban localities and 87.37% in rural ones.
- Most of (52.98%) the quilombola population living in rural localities, inside Quilombola Territories, are aged 29 or under, with a median age of 27.
- In urban localities, there are 92 quilombola men for every 100 quilombola women; in rural localities, 105 men for every 100 women.
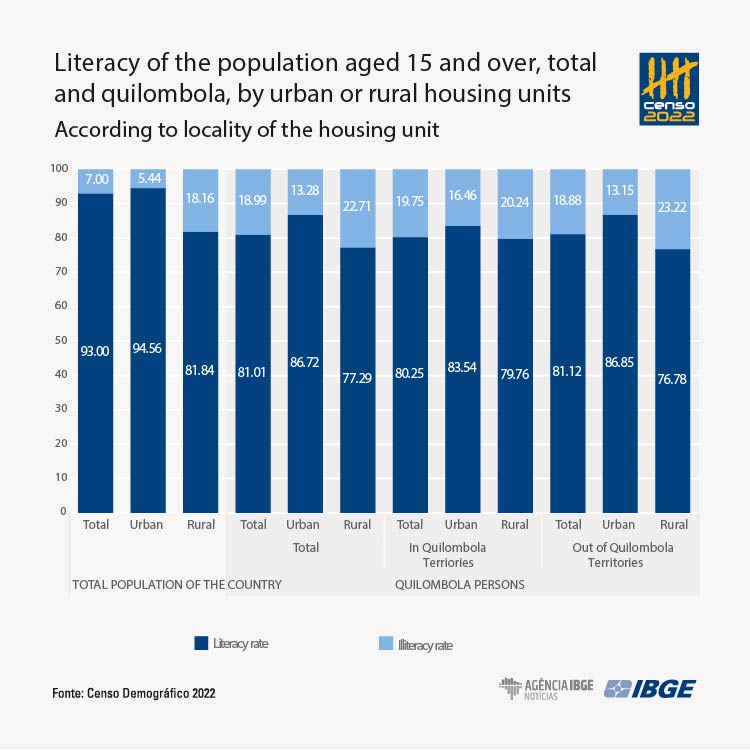
- The illiteracy rate of quilombolas in rural localities (22.71%) is 9.43 percentage points higher than in urban localities (13.28%).
- The illiteracy rate of quilombolas in rural localities are higher inside delimited Quilombola (79.76%) than out of them (76.78%).
- In territories, poor sanitation affects 63.74% of the quilombolas in urban localities and 93.82% of those in rural localities. For the total quilombola population, these percentages were 53,61% among residents of urban localities and reached 94.62% of the residents in rural localities.
- The access to water in cases of poorer sanitation hits 11.3% in the urban area of territories and 41.6% in rural localities of territories.
- The lowest proportions of quilombolas residents with a bathroom for exclusive use in the housing unit are among quilombolas in rural localities (74.61%) and in territories or rural status (72.34%).
- The poorest situations or absence of sewage disposal were found among residents of quilombola localities, with 83.37%.
- Among quilombolas living in urban Territories, the proportion of persons without access to direct or indirect waste disposal (14.36%) hits a figure ten times above that of the resident population in urban localities (1.43%).

The 2022 Census showed that most of the quilombola population (61.7%) lives in rural localities. In delimited Quilombolas Territories, the percentage reaches 87.37%. Data were released today (09) by the IBGE in the publication “2022 Census: Quilombolas – Main characteristics of persons and o f housing units, by urban or rural housing units.” The release event will be held today, at 10 am, at the Sciences Center of the Federal University of Juiz de Fora (UFJF), in the city of Juiz de Fora (MG). It will be streamed be streamed live on Digital IBGE.
The publication presents, for the first time, a series of topics with analysis of rural and urban localities, exclusively for the quilombola population. Among these, data about sex and age, literacy, birth records, besides characteristics of housing units with at least one quilombola residents in terms of sanitation, household composition and reported deaths. .
“The urban or rural status of housing units is decisive for the correct dimensioning of public policies, mainly of those related to schooling and sanitation,” says Fernando Damasco, manager of Traditional Territories and Protected Areas of the IBGE. “The figures show a completely different situation in comparison with the Brazilian population, which is mostly urban (87,41%). That fact refers to a set of specificities of this population, which need to be considered in the elaboration and execution of public policies,” he adds.
In Piauí, 87.9% of the quilombolas live in rural localities
Federal District (97.05%), Rondônia (81.61%), Goiás (72.97%) and Rio de Janeiro (72.72%) stand out for having more than 70% of their population living in urban localities. On the Other hand, Piauí stands out as the State with the highest percentage of quilombolas living in rural localities (87.87%), followed by Amazonas (84.92%) and Maranhão (79.74%).
Considering quilombolas living in delimited territories, the highest urban percentages are found in the Central West (20.9%) and South (20.,5%). The North region has the lowest percentage, with 3.66%. The Federation Unit with the highest percentage of quilombola population living in urban localities and in Quilombola Territories is Sergipe, with 31.31%, followed by Mato Grosso do Sul (28.20%), Amapá (22.25%), Paraíba (19.36%) and Ceará (17.53%).
In four Federation Units, more than 90% of the quilombola population living in rural localities have their housing units out of Quilombola Territories: Alagoas (97.32%); Minas Gerais (94.41%); Bahia (93.24%); and Pernambuco (90.19%).
Quilombola population has younger profile than general population
Researchers highlight that quilombolas in rural localities form, as a group, a younger age pyramid, which indicates a drop in fertility observed in the last 15 years. “We see, in urban localities, a relatively older population, with highlights in the group aged 20 to 69, of quilombola women. Maybe as a result of migration for professional purposes, or of choosing the city in search of new opportunities," remarks Marta Antunes, coordinator of the Census of Traditional Peoples and Communities.
The population aged 29 or under among quilombolas living in rural localities and in Quilombola Territories is equivalent to 52.98%, with a median age of 27; for the quilombola population in urban areas and out of territories, they are 45.70% aged 29 and over, with a median age of 32. The median age of the resident population in Brazil is 35.
The aging index (number of persons aged 60 and over in relation to a group of 100 persons up to 14 years of age) of the quilombola population is 54.98, a difference of 25 points against the general Brazilian population (80.03). The lowest aging indexes in the quilombola population are observed inside their territories, with 43.61 for rural localities and 44.23 for urban localities.
The sex ratio indicator for the quilombola population indicates male prevalence in rural localities, both in and out of quilomobola territories, and female prevalence in urban localities both in and out of quilombola territories. In urban localities, there were 92 men for every 100 quilombola women; in rural localities, 105 men for every 100 women.
Illiteracy in rural localities is 9.43 percentage points higher than in urban localities
In 2022, 1,015,034 quilombolas aged 15 and over lived in or out of delimited territories. A total of 81.01% (822,319 persons) were literate and, consequently, 18.99% (192,715 persons) were illiterate. Therefore, the illiteracy rate of quilombolas aged 15 and over was 2.7 times higher than that of the total resident population in Brazil.
Inside delimited Quilombola Territories, the literacy rate was 80.25%, below the national rate (93%) and below the general rate for quilombolas (81.01%). The illiteracy rate of quilombolas living in Quilombola Territories was 19.75%, above the national rate of 7.0%, and above the illiteracy rate of the quilombola population as a whole (18.99%)
The illiteracy rate of quilombolas in rural localities (22.71%) is 9.43 percentage points higher than in urban localities (13.28%). For all the age groups, quilombolas in urban localities have higher illiteracy rates than those in urban localities. Nevertheless, it should be considered that the literacy rates of quilombolas in urban areas are higher in delimited Quilombola Territories (79.76%) than out of them (76.78%).
“We observe there is a bigger investment in combating illiteracy and more education opportunities in rural areas inside territories, where there is a different type of education,” Marta explains. “there is Youth and adult education too, so you can bring Community into school, and the school has great relevance in the communities, mainly in the quilombola territories.”.
Regardless of the localities, quilombola women had lower illiteracy rates than quilombola men. In urban localities and out of official territories, the rates were 14.18% for men and 12.23%, for women; in rural localities and out of the territories, the rates were 25.48% for men and 20.87% for women.
99% of the quilombola children had a birth certificate
Of the 118,481 quilombola children up to five years of age, 99.02% had a birth certificate, a percentage slightly below that in the resident population (99.26%). The proportion of children up to five years of age without a birth certificate (0.87%) is very close to that of the resident population up to five years of age in the country (0.51%).
According to the localities and status of housing units, it is possible to observe that quilombola children without a birth certificate are concentrated in rural localities (743 quilombola children), with most of the resident population living in urban localities (72.54%), followed by residents of quilombola territories and and in rural localities (27.46%). The Northeast and North Regions concentrate 94.88% of these occurrences .
Less than 0.7% of the occupied permanent private housing units dos in the country had one or more quilombola residents
In 2022, considering the 72.4 million occupied permanent private housing units in Brazil, 474,747 (0.66%) had at least one quilombola resident. The average number of residents in these housing units is 3.25 (rural localities) and 3.07 (urban localities), whereas the national average is 2.79 residents per housing unit. This pattern is repeated in all Major Regions and Federation Units, except for the Federal District, where the average is 2.77 residents.
In housing units with at least one quilombola, 88.16% of the residents are quilombolas, evidencing the low ethnic heterogeneity among residents, especially in the territories: in rural localities, 98.20% of the residents are quilombolas; in urban localities, 94.81%. Out of the territories, the presence of non-quilombola residents in housing units with at least one quilombola resident is higher in urban localities (21.46%) than in rural ones (5.78%).
In territories in rural localities, 93.8% of the quilombolas face poor sanitation
In Quilombola Territories, 90% of the quilombola residents face poor sanitation to some extent, in relation to water supply, sewage disposal and waste disposal. They were 63.74% in urban areas and 93.82% in rural areas. For the total quilombola population, this percentage was 78.93%, being 53.61% among residents of urban areas, reaching 94.62% of the residents in rural localities. In the country as a whole, 27% of the population faced poor sanitation, being 18.71% of the residents of urban areas and 87.2% in rural areas.
In this respect, the IBGE considered as poor conditions the following situations:
- The main form of water supply is the public system, well, spring of piped source only up to the property or non existence of piped water, or cases where, without piped water, supply comes from water trucks, stored rainwater, rivers, weirs, dams, streams, lakes, creeks or other forms not previously listed;
- Forms of sewage disposal include a rudimentary cesspit, hole, ditch, river, stream, sea or other form, or non-existence of sewage disposal (due to the absence of a bathroom or toilet);
- Waste is not directly or indirectly collected by a cleaning service company (it is burned or buried in the property, thrown on wastelandt, hill or public area or other the like).
In Quilombola Territories, 29.58% of the quilombola residents experience the three levels of poor conditions simultaneously. Among the total quilombola population the percentage was 21.89%, whereas 3.0% of the resident population was in this condition. The percentage of housing units with at least one quilombola resident, in rural localities and combining the three levels, reached 33.22%.
As for access to water, the differences between urban and rural localities are also significant. Even in urban localities, the access to water in cases of poorer conditions is 3.4 times higher among the quilombola population (9.21%) than among residents of urban localities in Brazil (2.72%). In territories, it reaches 11.3%. In rural localities, there is a difference of 14.13 percentage points between quilombolas (43.48%) and the resident population of Brazil (29.35%). Considering only quilombola residents living in rural localities, the poor access to water reaches 42.61%.
As the main form of access to water, most quilombolas in urban areas used the general system (82.89% of the total quilombola population and 69.06% of the population in territories), whereas in rural areas rurais in quilombola territories deep or artesian well prevailed (33.74%) in relation to the general system (28.49%).
| Residents, total and quilombola, of occupied permanent private housing units, by main form of water supply of the housing unit, by locality and status of the housing unit - Brazil – 2022 |
|||||||||
|---|---|---|---|---|---|---|---|---|---|
| Population, locality and status of the housing unit | Residents, total and quilombola, of occupied permanent private housing units | ||||||||
| Total | Main form of water supply | ||||||||
| Public water supply system | Deep or artesian well | Well or waterhole | Spring | Water truck | Stored rainwater | Rivers, weirs, streams, lakes and creeks | Other | ||
| Absolute | |||||||||
| Resident population | 202,083,020 | 167,511,756 | 18,087,681 | 6,467,644 | 3,765,963 | 2,116,621 | 1,106,431 | 1.893.027 | 1,133,897 |
| Urban | 176.781,198 | 160,559,492 | 10,602,984 | 3,061,061 | 645,847 | 748,916 | 130,827 | 184,509 | 847,562 |
| Rural | 25,301,822 | 6,952,264 | 7,484,697 | 3,406,583 | 3,120,116 | 1,367,705 | 975,604 | 1,708,518 | 286,335 |
| Quilombolas | 1,327,483 | 716,725 | 272.320 | 115,034 | 53,310 | 57,177 | 42,390 | 52,232 | 18,295 |
| Urban | 507,953 | 421,048 | 49,617 | 16,649 | 5,636 | 6,013 | 1,641 | 1,732 | 5,617 |
| Rural | 819,530 | 295,677 | 222,703 | 98,385 | 47,674 | 51,164 | 40,749 | 50,500 | 12,678 |
| In Quilombola Territories | 167,542 | 56,319 | 53,362 | 17,561 | 10,408 | 6,698 | 5,767 | 15,621 | 1,806 |
| Urban | 21,171 | 14,620 | 3,978 | 1,246 | 278 | 597 | 110 | 214 | 128 |
| Rural | 146,371 | 41,699 | 49,384 | 16,315 | 10,130 | 6,101 | 5,657 | 15,407 | 1,678 |
| Out of Quilombola Territories | 1,159,941 | 660,406 | 218,958 | 97,473 | 42,902 | 50,479 | 36,623 | 36,611 | 16,489 |
| Urban | 486,782 | 406,428 | 45,639 | 15,403 | 5,358 | 5,416 | 1,531 | 1,518 | 5,489 |
| Rural | 673,159 | 253,978 | 173,319 | 82,070 | 37,544 | 45,063 | 35,092 | 35,093 | 11,000 |
| Percentage (%) | |||||||||
| Resident population | 100 | 82.89 | 8.95 | 3.20 | 1.86 | 1.05 | 0,55 | 0,94 | 0.56 |
| Urban | 100 | 90.82 | 6.00 | 1.73 | 0.37 | 0.42 | 0.07 | 0.10 | 0.48 |
| Rural | 100 | 27.48 | 29.58 | 13.46 | 12.33 | 5.41 | 3.86 | 6.75 | 1.13 |
| Quilombolas | 100 | 53.99 | 20.51 | 8.67 | 4.02 | 4.31 | 3.19 | 3.93 | 1.38 |
| Urban | 100 | 82.89 | 9.77 | 3.28 | 1.11 | 1.18 | 0.32 | 0.34 | 1.11 |
| Rural | 100 | 36.08 | 27.17 | 12.01 | 5.82 | 6.24 | 4.97 | 6.16 | 1.55 |
| In Quilombola Territories | 100 | 33.61 | 31.85 | 10.48 | 6.21 | 4.00 | 3.44 | 9.32 | 1.08 |
| Urban | 100 | 69.06 | 18.79 | 5.89 | 1.31 | 2.82 | 0.52 | 1.01 | 0.60 |
| Rural | 100 | 28.49 | 33.74 | 11.15 | 6.92 | 4.17 | 3.86 | 10.53 | 1.15 |
| Out of Quilombola Territories | 100 | 56.93 | 18.88 | 8.40 | 3.70 | 4.35 | 3.16 | 3.16 | 1.42 |
| Urban | 100 | 83.49 | 9.38 | 3.16 | 1.10 | 1.11 | 0.31 | 0.31 | 1.13 |
| Rural | 100 | 37.73 | 25.75 | 12.19 | 5.58 | 6.69 | 5.21 | 5.21 | 1.63 |
| Source: IBGE, Censo Demográfico 2022. | |||||||||
Seven percent of the quilombolas in territories in rural localities did not have a bathroom or toilet
As for the existence of bathroom or toilet in housing units, the 2022 Census surveyed four situations: with a bathroom (a room with a toilet and shower/bath facilities) for exclusive use (used only by residents and their guests); residents used bathroom shared by more than one housing unit; used “toilets or wholes for waste,” ether shared or not, included those located in the land; and those without bathrooms, toilets or holes for waste, indicating the existence of open defecation.
The proportion of quilombolas with a bathroom for exclusive use in the housing units in urban localities (96.14%) is 3.27 percentage points lower than when compared to residents of urban localities in Brazil (99.41%). The lowest proportion are found among quilombolas in rural localities (74.61%) and, mainly, in territories in rural localities (72.34%), where 14.51% use a “bathroom or toilet for waste,” and 7.03% did not have a bathroom, toilet or hole for waste.
| Residents, total and quilombola, of occupied permanent provate housing units, by status of existence of bathroom or toilet in the housing unit, by locality and status of the housing unit - Brazil – 2022 | |||||
|---|---|---|---|---|---|
| Population, locality and status of the housing unit | Residents, total and quilombola, of occupied permanent provate housing units | ||||
| Total | Status of existence of bathroom or toilet in the housing unit | ||||
| With a bathroom for exclusive use in the housing unit | With only a toilet shared by more than one housing unit | With only a toilet or hole for waste, including those located in the property | Without a bathroom or toilet | ||
| Absolute | |||||
| Resident population | 202,083,020 | 197,542,798 | 1,008,425 | 2,349,448 | 1,182,349 |
| Urban | 176,781,198 | 175,737,156 | 381,880 | 557,216 | 104,946 |
| Rural | 25,301,822 | 21,805,642 | 626,545 | 1,792,232 | 1,077,403 |
| Quilombolas | 1,327,483 | 1,099,816 | 44,516 | 129.364 | 53,787 |
| Urban | 507,953 | 488,346 | 5,533 | 12,385 | 1,689 |
| Rural | 819,530 | 611,470 | 38,983 | 116,979 | 52,098 |
| In Quilombola Territories | 167,542 | 126,049 | 9,281 | 21,765 | 10,447 |
| Urban | 21,171 | 20,157 | 323 | 531 | 160 |
| Rural | 146,371 | 105,892 | 8,958 | 21,234 | 10,287 |
| Out of Quilobola Territories | 1,159,941 | 973,767 | 35,235 | 107,599 | 43,340 |
| Urban | 486,782 | 468,189 | 5,210 | 11,854 | 1,529 |
| Rural | 673,159 | 505,578 | 30,025 | 95,745 | 41,811 |
| Percentage (%) | |||||
| Resident population | 100 | 97.75 | 0.50 | 1.16 | 0.59 |
| Urban | 100 | 99.41 | 0.22 | 0.32 | 0.06 |
| Rural | 100 | 86.18 | 2.48 | 7.08 | 4.26 |
| Quilombola | 100 | 82.85 | 3.35 | 9.75 | 4.05 |
| Urban | 100 | 96.14 | 1.09 | 2.44 | 0.33 |
| Rural | 100 | 74,61 | 4,76 | 14,27 | 6,36 |
| In Quilombola Territories | 100 | 75.23 | 5.54 | 12.99 | 6.24 |
| Urban | 100 | 95.21 | 1.53 | 2.51 | 0.76 |
| Rural | 100 | 72.34 | 6.12 | 14.51 | 7.03 |
| Out of Quilombola Territories | 100 | 83.95 | 3.04 | 9.28 | 3.74 |
| Urban | 100 | 96.18 | 1.07 | 2.44 | 0.31 |
| Rural | 100 | 75.11 | 4.46 | 14.22 | 6.21 |
| Source: IBGE, Censo Demográfico 2022. | |||||
As for forms of sewage disposal, in the quilombola population, 62.17% of the housing units and 70.53% of the residents had as main form the rudimentary cesspit, hole, ditch, river, stream, sea, other form or absence of sewage disposa. The poorest condition or absence of sewage disposal was found among residents of rural areas, with 83.37%, eight percentage points more in comparison with the proportion of the population living in the same conditions in urban localities (75.37%).
It is also possible to see inequalities in the access to direct or indirect waste disposal services (garbage collected in the housing unit by a cleaning service company or dumped in a dumpster), according to the conditions and status of housing units with at least one resident quilombola, in relation to the resident population. Among quilombolas, the proportion of persons in urban localities without access to that service (6.81%) is 4.8 times higher than in the population living in urban areas (1.43%). For quilombola residents in territories of urban localities, the proportion (14.36%) is ten times higher.
| Residents, total and quilombola, in occupied permanent provate housing units, by form of sewge disposal of the housin unit, by location and status of the housing unit - Brazil – 2022 | |||||
|---|---|---|---|---|---|
| Population, locality and status of the housing unit | Residents, total and quilombola, of occupied permanent provate housing units | ||||
| Absolute | Percentage (%) | ||||
| Total | Form of sewage disposal | Form of sewage disposal | |||
| Public system or river or sceptik tank or filter | Rudimentary cesspit, hole, ditch, river, stream, sea, or other form of sewage disposal or no sewage disposal due to the lack of a bathroom or toilet | Public system or river or sceptik tank or filter | Rudimentary cesspit, hole, ditch, river, stream, sea, or other form of sewage disposal or no sewage disposal due to the lack of a bathroom or toilet | ||
| Resident population | 202,083,020 | 153,052,699 | 49,030,321 | 75.74 | 24.26 |
| Urban | 176,781,198 | 146,820,166 | 29,961,032 | 83.05 | 16.95 |
| Rural | 25,301,822 | 6,232,533 | 19,069,289 | 24.63 | 75.37 |
| Quilombola | 1,327,483 | 391,201 | 936,282 | 29.47 | 70.53 |
| Urban | 507,953 | 254,876 | 253,077 | 50.18 | 49.82 |
| Rural | 819,530 | 136,325 | 683,205 | 16.63 | 83.37 |
| In Quilombola Territories | 167,542 | 40,170 | 127,372 | 23.98 | 76.02 |
| Urban | 21,171 | 9,740 | 11,431 | 46.01 | 53.99 |
| Rural | 146,371 | 30,430 | 115,941 | 20.79 | 79.21 |
| Out of Quilombola Territories | 1,159,941 | 351,031 | 808,910 | 30.26 | 69.74 |
| Urban | 486,782 | 245,136 | 241,646 | 50.36 | 49.64 |
| Rural | 673,159 | 105,895 | 567,264 | 15.73 | 84.27 |
| Source: IBGE, Censo Demográfico 2022. | |||||
61% of the housing units with at least one quilombola has a householder and a partner
In 2022, there were 475,445 housing units with at least one quilombola, with an average number of 3.17 residents. “Domestic units” are occupied housing units, either permanent or improvised. In Brazil, only 698 improvised private domestic units have at least a quilombola, that is, 99.85% of the domestic units are in permanent private housing units (474,747).
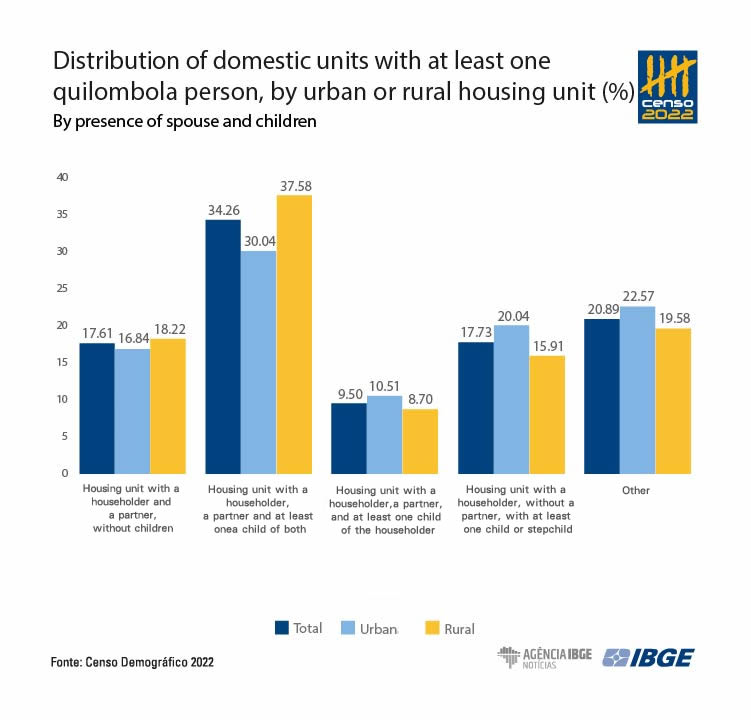
Most of the housing units with at least one quilombola have a householder and a partner (61.16%), with a limited occurrence of same-sex partners (0.21%). The absence of a partner is above 35% in all the localities and status of the housing unit, where urban localities stand out as the absence of a partner reaches 42.61%.
As for composition, most domestic units are formed by a householder, partner and children of both, 34,26% (162,902 housing units). In the second position come those with a householder without a partner, but with children and/or stepchildren (17.73%,), then domestic unit s with a householder, a partner, without children (17.61%) and units with a householder and a partner with at least one child only of the householder or of the partner (9.50%). Other arrangements amounted to 20.89%.
Of the 475,445 domestic units with at least one quilombola resident, 92.84% had quilombolas as householders. In rural localities, the percentage rises to 96.70% and, in urban localities, it drops to 87.93%. In rural localities and inside quilombola territories, this percentage reaches 98.69%.
In domestic units with quilombolas, 50.36% of the householders were women. In urban localities, the difference is bigger between male (45.62%) and female householders (54.38%). On the other hand, in rural localities, male householders prevail, with 52.81%. The same pattern is found inside delimited Quilombola Territories and in rural localities. Those units in quilombola territories in urban localities had a prevalence of women, with 57.59%.
Most householders of housing units with a quilombola are aged 40 to 59 years of age (40.36% of the householders). In this age group, they represent 41.96% of those in urban localities and 39.09% of those in rural ones.
Reported deaths
Between August 2021 and July 2022, there were 10,230 reported deaths in private housing units with at least one quilombola resident. A total of 61.05% were residents aged 60 and over, and 4.26% were persons aged 0 to 4.
A comparison between the distribution of reported deaths by age groups among quilombolas and the distribution of deaths in the resident population in Brazil, in showed a bigger percent participation of deaths in younger age groups in housing units with quilombolas. In some groups, this difference was striking, as among infants under one year of age, which represented 3.30% of the deaths in housing units with quilombolas, and 1.73% of deaths in the country.
Marta Antunes highlights that these figures do not refer to deaths of quilombolas. “Not all housing units have 100% of quilombolas, so that is an approximation,” He also highlights possible male excess mortality, above 3 male deaths for every female death in the group aged 15 to 34, with a highlight to the homicides, suicides, car accidents, among others. However, researchers inform that excess male mortality information must be used carefully, because these are scattered data.
More about the survey
The Population Census is the most complete statistical operation in the country, covering all the 5,570 Brazilian municipalities. The first results of the 2022 Population Census for quilombolas were released in July 2023 and are available on the IBGE News Agency. A second round of results was released in December the same year, and counted 1,330,186 quilombolas in 25 Federation Units. In May 2024, demography for the quilombola population in Brazil was inaugurated, with of analyses by sex and age, and, in June, the IBGE released information on literacy and sanitation.
The publication ““2022 Census: Quilombolas - Main characteristics of persons and of housing units, by urban or rural housing units” presents information about the main characteristics of quilombola persons and housing units, by urban or rural locality, in and out of delimited Quilombola Territories for Brazil, Major Regions, Federation Units, Municipalities, Legal Amazon, Legal Amazon by Federation Units, delimited Quilombola Territories and Quilombola Teritories by Federation Units.
The data are also available at the Interactive Geographic Platform (PGI), the 2022 Census Overview, Sidra and on the Geographic Chart.