Semiannual PINTEC
More than 70% of industrial companies with 100 or more employed persons innovated in 2021
December 15, 2022 10h00 AM | Last Updated: December 19, 2022 05h50 PM
Highlights
- In 2021, the innovation rate of industrial companies with 100 or more employed persons was 70.5%. Of this total, 37.8% implemented new products and business processes simultaneously.
- The innovation rate is higher in large companies, reaching 76.7% in companies with more than 500 employees.
- The chemical sector leads, with an innovation rate of 87.0%, followed by the sectors of computer, electronic and optical equipment (86.5%) and motor vehicles (84.7%).
- In 2021, 33.9% of the companies invested in R&D. In the sectors of IT equipment, chemicals and pharmaceuticals, the rate exceeds 60%
- In 2022, 37.0% of innovative companies intended to increase R&D expenditures compared to 2021. For 2023, 58.4% expect to increase these expenditures.
- In 2021, 12.0% of companies published a sustainability report; the index reaches 28.7% among companies with more than 500 employed persons.
- Among companies that published sustainability reports, 81.8% were innovative in 2021.
- 52.7% of the innovative companies maintained innovative activities during the pandemic.
- The semiannual edition will complement the traditional PINTEC, which will continue to go in the field every three years.
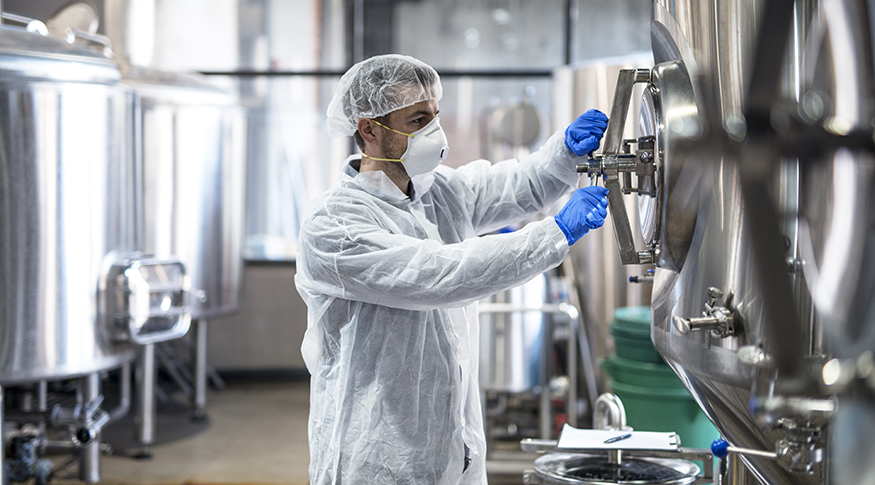
In 2021, the innovation rate in Brazil was 70.5%, a percentage related to industrial companies with 100 or more employed persons that launched a product or implemented a new or substantially improved business process. Of these, 37.8% launched products and implemented new business processes; 20% implemented only new business processes; and 12.7% launched only new products. By range of employed persons, the largest companies are the most innovative: those with 500 or more employed persons have a rate of 76.7%; those from 250 to 499, 75.3%; the index drops to 66.6% in the range of those with 100 to 249.
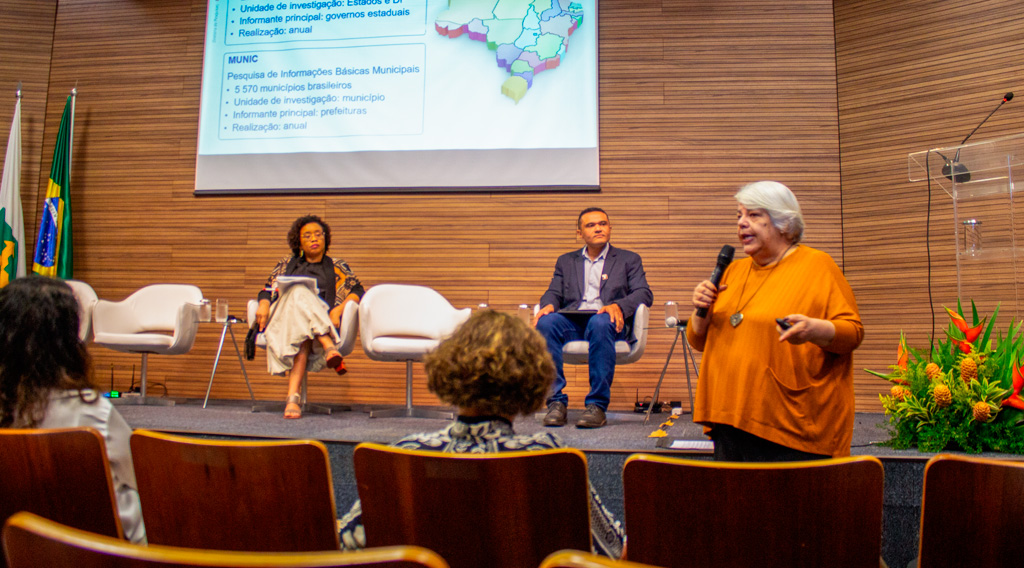
The data are part of the 2021 Semiannual Innovation Survey (Semiannual Pintec): Basic Indicators, an unprecedented investigation that brings new data on innovation and related topics. The objective is to draw a portrait of innovation in Brazil, by gathering information regarding business investment in Science, Technology and Innovation in the country.
The survey, of an experimental nature, investigated a sample of 1,454 medium and large companies – over 100 employed persons – from the manufacturing and mininga and quarrying industries, from a universe of 9,408 companies with this profile. The data will support the implementation, improvement and monitoring of public policies and companies' strategies.
The themes covered incidence of innovation, cooperation, obstacles, companies that spent on R&D, expectations of expenditure on R&D, impacts of the Covid-19 pandemic and publication of a sustainability report. There are data for Brazil, without regional disaggregation. The survey results from a partnership between IBGE, the Brazilian Agency for Industrial Development (ABDI) and the Federal University of Rio de Janeiro (UFRJ).
The goal is to provide, every six months, relevant and reliable statistics that point out trends and, at the same time, are a thermometer of the situation of innovation in the national productive sector.
Semiannual PINTEC will complement triennial PINTEC
With an annual reference period (relative to the previous year of collection) and two evaluations in the semester, the survey investigates, in the first semester, rotating thematic indicators (such as digitization) and, in the second, fixed basic indicators (innovation and R&D). The purpose of the Semiannual PINTEC is not to replace the traditional IBGE Survey of Innovation (PINTEC) – already with seven editions carried out in a compreehensive way every three years, since 2000, and which will continue to be edited – but rather to complement it.
“The surveys are named PINTEC because both address the innovation theme, but their data cannot be compared, since they have different samples, different collection methods, in addition to having had relevant changes in the main concepts of innovation. It is worth noting that the Semiannual PINTEC is a new survey that bears the seal of experimental”, clarifies Ms. Fernanda de Vilhena, manager of Structural and Thematic Analysis at the IBGE.
The 1st edition of Semiannual PINTEC 2021 brings results for basic innovation indicators, referring to the year 2021, for the universe of companies with 100 or more employed persons in the Brazilian industry. The collection was of short duration, between August 1st and October 14th, 2022, in a hybrid model, initiated by telephone calls, in order to find the best informant, within the company, to answer the survey themes, followed by self-completion of the electronic questionnaire. In the first half of next year, the survey returns to the field with a thematic questionnaire, with release scheduled for the second half of 2023.
According to the coordinator of Structural and Thematic Statistics at the IBGE, Mr. Alessandro Pinheiro, the new PINTEC follows an international methodology and fill in fundamental gaps. The new project brings data more quickly, making up for the lack of official indicators with half-yearly collection and annual periodicity.
Ms. Vilhena explains that the survey uses the concepts of the 4th edition of the Oslo Manual, 2018, which consolidated the innovation categories of the previous 2005 version (process innovation, organizational innovation and marketing innovation) into a new and single category of business process innovation; keeping the product innovation category very similar to the previously used approach.
Chemical sector leads ranking of innovative companies, with rate of 87.0%
The chemical products sector leads the ranking of innovative companies with a rate of 87.0%, surpassing even computer, electronic and optical equipment, the second, with 86.5%, and motor vehicles, with 84.7%.
Considering the percentage of innovative companies in product (50.5%) once again, the chemical sector leads (76.0%); followed by miscellaneous products (74.4%), including hospital materials; machinery and equipment (71.9%); and pharmaceuticals (69.9%).
“In this pandemic period, it makes sense to invest in the innovation of hospital products, as well as in pharmaceuticals, all of them with an index close to 70%.” analyzes Thematic Survey manager Flávio José Marques Peixoto.
The survey also allows the analysis of the degree of novelty of the main product innovation. “Among the industrial companies that innovated in product, the trend is for incremental innovation: 65.6% of the products were new only for the company; 28.9% were new to the national market, and only 5.5% were innovations for the international market. This shows how much complex product innovation can be. The product already exists on the market, but the company started to improve it, and not necessarily created a new product”, emphasizes Mr. Peixoto.
Also concerning main product innovation, for 65.0% of the companies, the innovation occurred as expected; for 16.2%, they exceeded expectations; and 14.1%, lower than expected; while 4.7% consider that it is still too early to evaluate.
Half of companies innovates in business process
The rate of innovation in business processes is 57.9%, a percentage that exceeds 60% among large companies. Business processes related to work organization concentrate the highest percentage of innovation (40.6%), followed by management practices or external relations (37.5%), marketing (33.5%), information processing and communication (32.5%) and production of goods or services (31.6%). Only innovation in accounting processes and administrative operations, and in delivery and distribution logistics record rates below 30%.
The sector of computer, electronic and optical equipment is the one with the highest incidence of innovation in business processes (79.2%), followed by the sector of chemical products (73.7%) and motor vehicles (70.9%). .
“Of the seven categories of processes, 13.2% of the companies presented a more robust behavior, innovating in six or seven categories. Another 26.6% innovated between three and five types of processes and 18% innovated in one or two business processes. But the majority, 42.1%, did not do business process innovation”, highlights Mr. Peixoto.
33.9% of companies invested in R&D
Considering the set of innovative industrial companies, 33.9% invested in research and development. The sectors that stood out in this indicator were computer, electronic and optical equipment (66.6%), chemical products (65.3%) and pharmaceuticals (63%). In less technological sectors, such as clothing, wood and maintenance and recovery, the rate is less than 3%.
The highest percentage of companies that invest in R&D (56.3%) occurs in large companies, over 500, and between 250 and 499 employed persons (36.8%).
58.4% of innovative companies intend to increase their investments in R&D in 2023
Among innovative companies, almost 60% intended to maintain expenditures on R&D in 2022, and 37.0% would increase in relation to 2021; only 3.2% expected a decrease. For 2023, the forecast is even more optimistic: 58.4% expect to increase their expenditures on R&D in relation to 2022, and 41.4% intend to maintain it. Only 0.2% intend to decrease.
Among non-innovative companies, 84.4% do not intend to spend on R&D in 2022. However, for 2023, 30.3% expect to increase expenditures in the area.
Cooperation with suppliers reaches 35.3%
The percentage of companies that made a joint effort to innovate was 41.7%. This rate rises to 55.3% among large companies. Cooperation takes place mainly with suppliers (35.3%), customers or consumers (31.2%), consultants or consulting firms (28.1%), science, technology and innovation infrastructure (25.7%), other group company in Brazil or abroad (16.1%), competitors (9.1%), startups (8.7%).
About 60% of innovative companies face instability, competition and limited resources
For 59.1% of the companies, there were obstacles to innovation, the main ones being economic instability (57.1%), increased competition (53.0%) and limited capacity of internal resources (50.5%). Other difficulties include scarcity of public resources, changes in strategic priorities, low attractiveness of demand, difficulty in establishing partnerships and technological limitations external to the company.
“The beverage and apparel sectors were the ones that most indicated difficulties, but the pharmaceutical industries also pointed out obstacles. Regarding the profile, the smaller companies are the ones that faced more problems in innovating. Regarding non-innovative companies, the percentage is lower, 33.9% - which is curious because they did not innovate. Also in this group, the main obstacle is economic instability, followed by the limited capacity of internal resources, fiercer competition and low attractiveness of demand; and in terms of size, small companies were also the most affected”, adds the Thematic Survey manager.
12.0% of companies published sustainability reports
In 2021, 12.0% of companies published a sustainability report; the index reaches 28.7% among companies with more than 500 employed persons. Among companies that published sustainability reports, 81.8% were innovative in 2021.
“Usually, they are sectors subject to some environmental norm or legislation that bring the need for a more accurate look at more sustainable practices. It is noteworthy that more than 80% are innovative companies”, reiterates Mr. Peixoto.
Pandemic had little effect on carrying out innovation activities
More than half (52.7%) of innovative companies maintained their innovation activities during the pandemic; the percentage reached 85.7% in the pharmaceutical sector and 95.6% in mining and quarrying industries. Only 32.6% of innovative companies slowed down their innovation activities, and 4.4% discontinued them.
“It is quite consistent that the pharmaceutical sector needed to maintain its innovation activities during the pandemic. Among the companies whose activities slowed down, the sectors of maintenance and repair, motor vehicles and miscellaneous products stand out. Another highlight is that the footwear and leather sector led, in terms of incidence (43.1%), new innovation activities during the pandemic, which reached a rate of 10.2%”, analyzes Mr. Peixoto.
As for non-innovative companies, 31.8% said they did not carry out innovative activities due to the pandemic. The sectors that stood out the most were printing and recording reproduction (100%), manufacturing of electrical machines, equipment and materials (63.1%), leather preparation and manufacturing of leather goods and footwear (56.5% ) and furniture manufacturing (50.1%).


