Continuous PNAD
Population increases, but number of persons under 30 falls by 5.4% from 2012 to 2021


July 22, 2022 10h00 AM | Last Updated: July 23, 2022 02h17 AM
Highlights
- The number of persons under 30 years of age in the country fell by 5.4% between 2012 and 2021. In the same period, the Brazilian population increased by 7.6%, and reached 212.7 million in 2021.
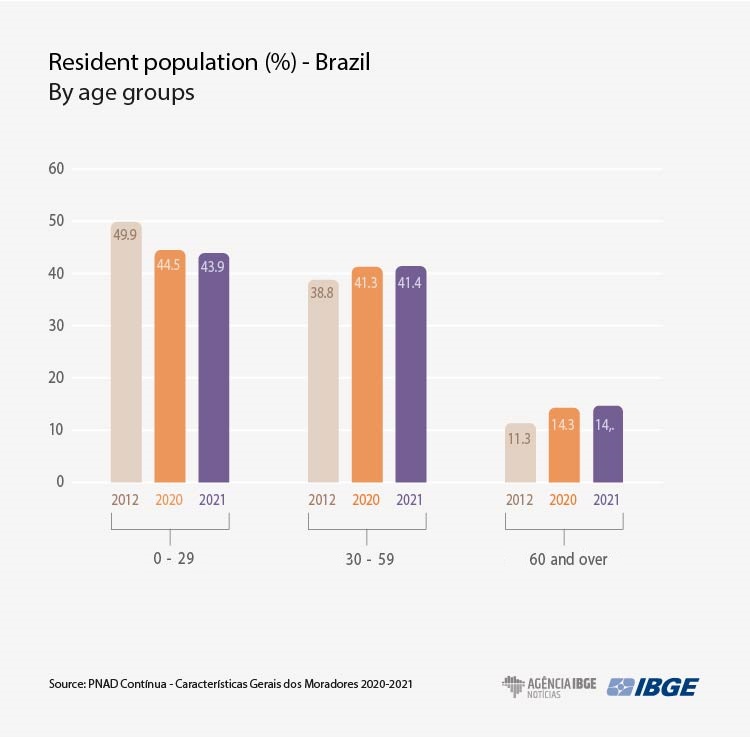
- The group aged 30 and over represented 56.1% of the country’s population in 2021, against 5.1% in 2012.
- In ten years, the proportion of single-person domestic units (with at least one resident) changed from 12.2% to 14.9% of the total. Men were 56.6% of the persons living alone.
- Between 2012 and 2021, there was increase in the participation of self-identified black (from 7.4% to 9.1%) and brown persons (from 45.6% to 47.0%) in the country’s population. The share of self-identified whites fell from 46.3% to 43.0%.
- In ten years, the self-identified black population increased by 32.4% and the brown ones, by 10.8%, rates that exceed the overall population increase (7.6%) in Brazil The self-identified white population remained stable.
- In ten years, the share of persons aged 60 and over went from 11.3% to 14.7% of the population.
- The youth dependency ratio fell from 34.4% to 29.9 children and teenagers per every 100 persons at potential working age, from 2012 to 2021. The elderly dependence ratio, in the same period, increased from 11.2 to 14.7.
- In 2021, Brazil had 95.6 men for every 100 resident women. The North was the only Major Region with a higher concentration of men (102.3 per every 100 women).
Brazil’s population is older. Between 2012 and 2021, the number of persons under 30 years of age fell 5.4%, whereas all the groups above that age bracket recorded increase in the period. As a consequence, persons aged 30 and over made up 56.1% of the total population in 2021. This percentage was 50.1% in 2012, start of the time series for the Continuous National Household Sample Survey - General Characteristics of Residents Data were released today (22) by the IBGE.
The total country’s population was estimated at 212.7 million in 2021, with an increase of 7.6% from 2012. In this period, the share of persons aged 60 and over went from 11.3% to 14.7% of the population. In absolute figures, this age group changed from 22.3 million to 31.2 million, with an increase of 39.8% in the period.
“Data show a decrease in the share of the population under 30 and, also, of this population in absolute figures. The decrease is a consequence of the steep drop of fertility that has been observed in the country in the last few decades and that has been shown in other IBGE surveys,” says Gustavo Fontes, analyst of the survey. The number of persons under 30 in the country went from 98.7 million in 2012 to 93.3 million, last year.
The researcher explains that the estimates of sex and age ranges for Brazil, being in accordance with the Population Projections, have not yet incorporated the effects of the pandemic, such as the drop in the number of birtths and the rise in the number of deaths. “The 2022 Census results will be employed in the update of these parameters.” Data collection for the Census starts on August 1st.
The survey also showed the demographic dependency ratio of the country’s population, a measure that helps us understand the relevance of the age group considered economically dependent on the group at potential working age. The dependence ratio can be separated into two age groups considered economically dependent: children and teenagers (0 to 14 years of age) and that of persons aged 65 and over.
The results of this indicator have been changing in the last few years as the population grows older. The youth dependency ratio changed from 34.4 children and teenagers for every 100 persons at potential working age, in 2012, to 29.9, in 2021. The elderly dependency ratio increased from 11.2 to 14.7 in the same period.
“That means a change in the structure of the Brazilian population, which reflects the drop in the number of youngsters and increase in the number of elederly persons. This indicator evidences the economic burden of these groups on the population with a bigger potential of doing labor activities. We know there are elderly persons in the labor market, besides persons at working age who are out of the workforce. But the indicator is important to indicate the potential need of redirecting public policies, including those relative to social security and health,” Mr. Fontes explains. /p>
In 2021, the North Region had the biggest concentration of younger age groups. About 30.7% of its population were under 18 years of age. The Northeast was in the second position (27.3%). Both the North and the Northeast recorded the biggest reductions in the population in this age bracket in comparison with other Major Regions.
Persons aged 60 and over, in their turn, are mostly concentrated in the Southeast (16.6%) and in the South (16.2%). On the other hand, only 9.9% of the residents in the North are elderly ones. Against 2012, the participation of the elderly population increased in all the Major Regions. Among the states, those with a bigger concentration of elderly persons are in Rio de Janeiro (19.1%) and Rio Grande do Sul (18.6%). Roraima has the smallest share of this age group in its population (7.7%).
In this 10-year period, the Central West recorded the biggest population increase (13.0%), followed by the North (12.9%). However, both Major Regions accounted for the biggest shares in the total population (7.8% and 8.7%, respectively). The Southeast, the most populous Major Region, increased its share by 7.3% and held 42.1% of the population in 2021. The Northeast, on the other hand, recorded the smallest population increase in the period (5.1%) and held 27.1% of the country’s population.
Share of black and brown persons in the country’s population records increase
Between 2012 and 2021, the participation of the self-identified white population fell from 46.3% to 43.0%. In the same period, there was increase in the participation of self-identified black persons (from 7.4% to 9.1%) and brown ones (from 45.6% to 47.0%). Since 2015, according to Continuous PNAD, most of the resident population in the country is formed by self-identified brown persons.
In ten years, the black population increased by 32.4% and the brown population, by 10.8%, both with an increase that exceeded that of the total population in the country (7.6%). The white population remained stable.
The Northeast had the biggest proportion of sel-identified black persons, with 11.4%, followed by the Southeast (9.6%) and Central West (8.7%). Bahia (21.5%) and Rio de Janeiro (14.2%) were the states with the biggest quantity of black persons. The Major Region with most of the brown population were the North (73.4%), Northeast (63.1%) and Central West (55.8%).
In the South (75.1%) and in the Southeast (50.7%), there was a predominance of white persons, whereas the North had the lowest estimate of this population: 17.7%.

In ten years, percentage of persons who live alone records increase
In 2021, there were 72.3 million permanent private housing units, against 61.5 million in 2012. In these housing units, the most common arrangement was the nuclear one, formed by a single family nucleus, which can be a couple with ir without children or stepchildren by the families known as single-parent ones, when only the mother or father raise the children, without the spouse’s participation.
Also in 2021, domestic units with a nuclear arrangement corresponded to 68.2% of the total, a percentage close to 2012. In this period, the proportion of single-person domestic units (with only one resident) changed from 12.2% to 14.9% of the total. Among the persons who live alone, men were the majority (56.6%). The share of women in this type of household arrangement was higher in the Southeast (46.4%) and in the South (46.5%), whereas in the North it was just 32.7%.
The survey shows other differences between persons who live alone. “There is an age pattern. Of the women who live alone, about 60% are elderly, whereas men who live alone are, on the average, younger,” says the researcher.

Women are 51.1% of the country’s population
In 2021, women were 51.1% of the country’s population, amounting to 108. 7 million, whereas men corresponded to 48.9% (103.9 million). In ten years, there was no significant difference in these participations.
The sex ratio, division between the number of men and women, indicated the existence of 95.6 me for every 100 resident women in the country. This figure is similar to that in 2012. But there are regional differences: the North is the only Major Region with a bigger concentration of men (102.3 for every 100 women). In the Northeast, there is bigger female participation (93.9 men for every 100 women).
The researcher indicates that this difference may be originated in migration flows. “Besides the difference in mortality, that can be related to migration patterns. One of the possibly influential factors is the type of economic activity performed in each Major Region. In agricultural and mineral frontiers, for example, the type of work attracts male workforce most commonly.”
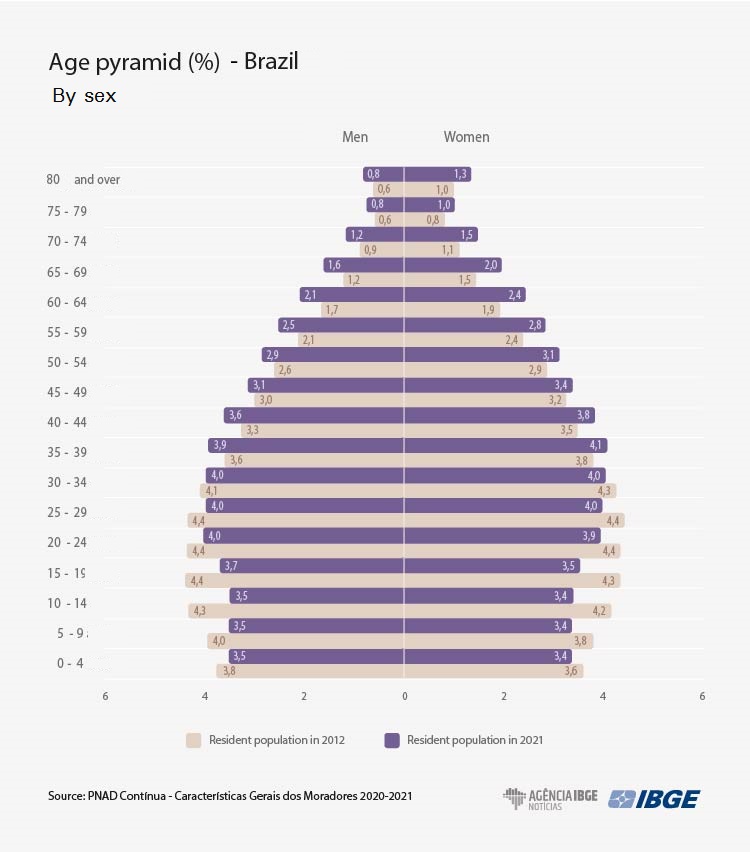
There is a trend to decrease of the sex ratio with the increase of age. Among persons aged 25 to 29, the number of men and women was similar: each one of them represented 4.0% of the total population. But the proportion of women exceeded that of men in all the age groups from 30 on. In the group aged 60 and over, there were 78.8 men for every 100 women.
“The male population has a younger profile. More men are born, but the difference from women decreases as age increases, because mortality tends to be higher among men,” says Gustavo Fontes. This bigger female participation in groups older than 30 years of age can be observed in the age pyramid, which also shows a wider top and a narrower base, a consequence of population aging.