System of National Accounts
With increases in Industry and Services, GDP grows by 7.7% in Q3
December 03, 2020 09h00 AM | Last Updated: December 07, 2020 01h02 PM

Gross Domestic Product (GDP) increased by 7.7% in Q3 from Q2, the biggest change since the start of the time series in 1996, but not yet at a rate that can make up for pandemic-related losses. With this result, the country’s economy is at the same level as in 2017, with cumulative loss of 5% from January to September, against the same period in 2019.
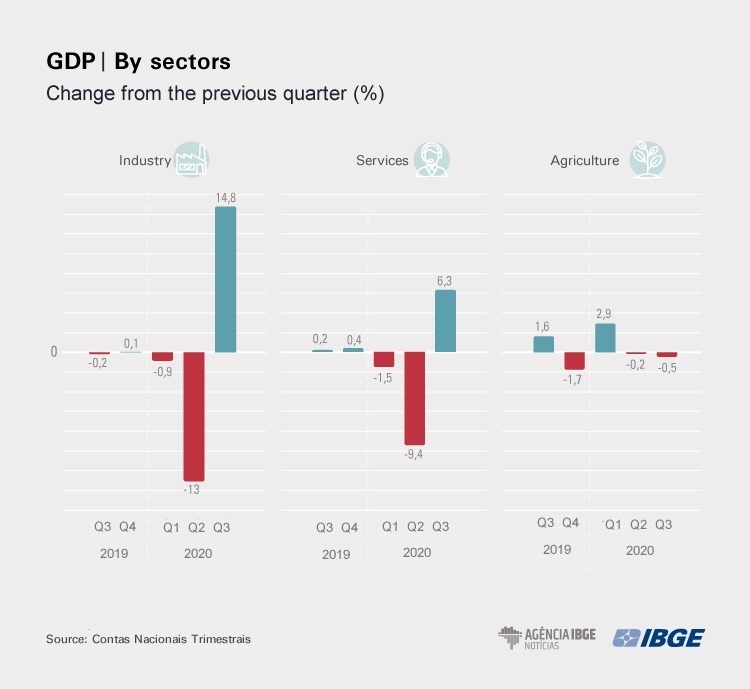
Industry grew by 14.8% and Services, by 6.3%, whereas Agriculture stayed at -0.5%. Against the same period in 2019, GDP, which is the final value of the goods and services produced in the country, fell 3.9% and hit R$1,891 trillion in current values, with R$ 1,627 trillion as Value Added at Basic Prices and R$ 264,1 billion as Product Taxes Less. Data comes from the System of Quarterly National Accounts, released today (3) by the IBGE.
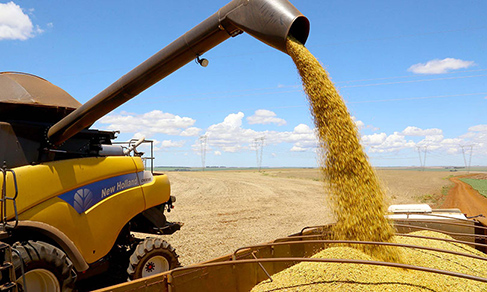
We have grown from a very low basis in Q2, at the peak of the pandemic. Recovery came in Q3, but considering the interannual rate, with a decrease of 3.9% and in terms of cumulative figures in the year, we are still heading downwards, both Industry and Services. Agriculture is the only segment recording increase in the year, mostly due to soybean, our main crop,” Rebeca Palis, head of National Account at the IBGE, highlights.
Q3 is 4.1% below Q4 in 2019, prior to pandemic impacts, and 7.3% far from the series peak, in Q1 2014.
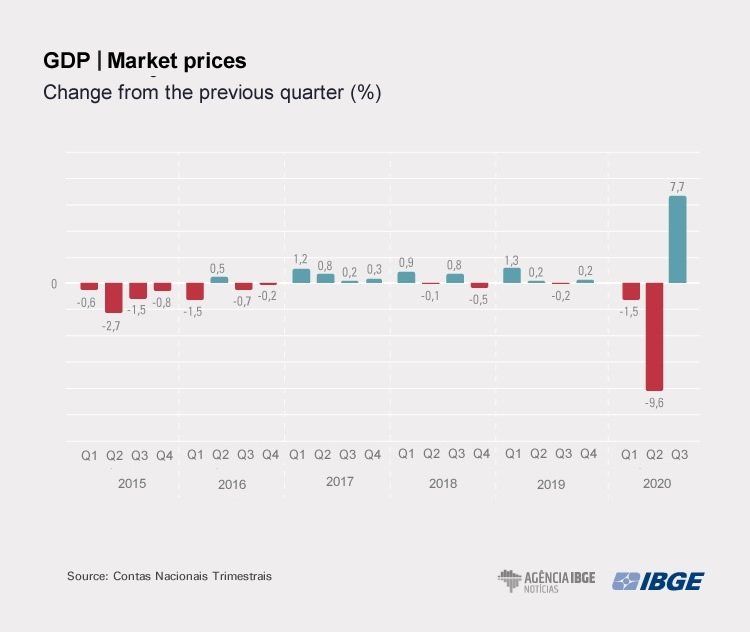
In the quarter, GDP increase was mainly due to the performance of Industry, with a highlight to the 23.7% increase in Manufacturing. There were also increases in Electricity and gas, water, sewage and reside management activities Construction and (5.6%) Mining and quarrying industry (2.5%).
“From the productive perspective, the highlight was Manufacturing industry, with a decrease in Q2, by -19.1%, mainly due to ongoing restriction measures. Industry grew, as a whole (14.8%) and Manufacturing also, by 23.7%, but we have come back to the level recorded in Q1,” Ms. Palis expalins.
Services advanced 6.3%, but without making up for losses
Another highlight was the sector of Services, which is the most relevant to the economy, and recorded increases in all of its segments: Trade (15.9%), Transportation, storage and mailing (12.5%), Other service activities (7.8%), Information and communication (3.1%), Administration, defense, public health and education and social security (2.5%), Financial activities, insurance and related services (1.5%) and Real estate activities (1.1%).
“Services fell 9.4% in Q2 and grew 6.3% in Q3. But there was no recovery to Q1 levels since there were decreases in both supply and demand. Despite the flexibilization of restriction measures, people still feel afraid and that affects consumption, mainly of services rendered to families, such as lodging, feeding, movie theaters, gym centers and beauty shops. Their performance surpassed that of Q2, but we have not reached prior-to-pandemic levels,” Ms. Palis highlights.
As for the negative change of 0.5% in Agriculture, Ms. Palis says there has been harvest adjustment. “A highlight is the increase of 2.4% cumulative in the year, versus a decrease of 5.1% in Industry and 5.3% in Services.”
Household consumption up 7.6% in line with GDP performance
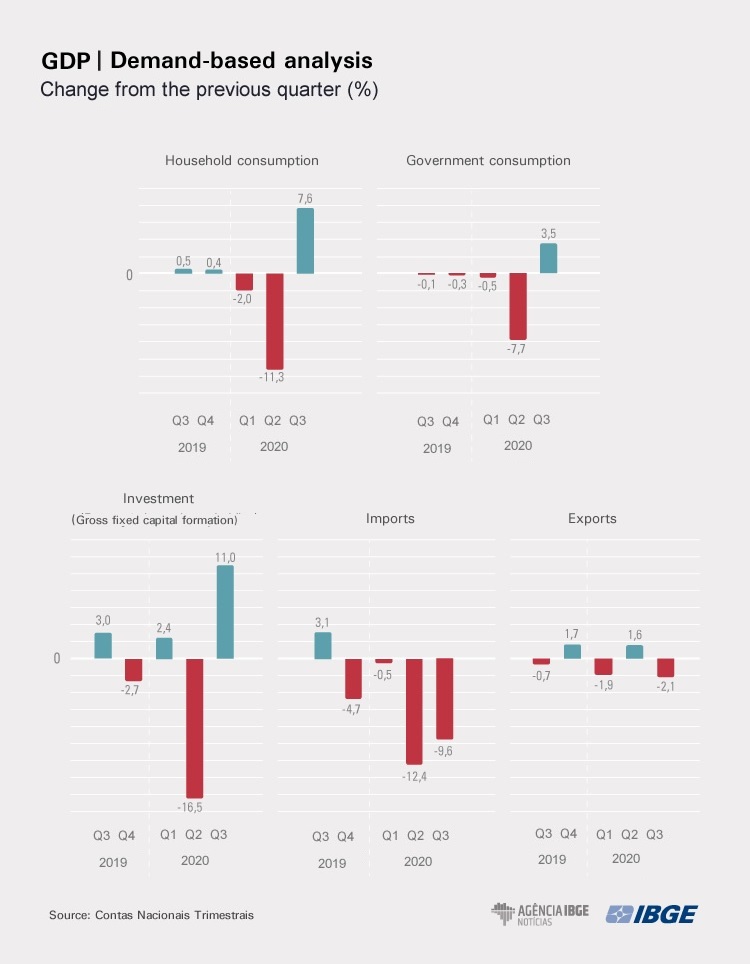
From the perspective of spending, household expenditure is the most relevant item (65%), recording an increase of 7.6%, at a level close to GDP. The survey manager observes that the indicator had fallen 11.3% in Q2, but in Q3 consumption increased significantly – especially of durable goods and feeding goods from the agrifood chain. “Consumption of services also recorded increase, since families have not gone back to consumption patterns of before the pandemic.”
Investments (Gross Fixed Capital Formation) grew 11%. However, according to Ms. Palis the performance is related to the basis for comparison in the second quarter, which had fallen by 16.5%. “In terms of cumulative index in the year, decrease was of 5.5%. And the country still has investments in imported equipment and, because the dollar is high, it pushes results downwards.”
As for the external sector, Exports of Goods and Services recorded a decrease of 2.1%, whereas Imports of Goods and Services fell 9.6% against the second quarter in 2020. According to Rebeca Palis, currency exchange is one of the factors accounting for that.
“Imports fell due to the low economic activity and to the depreciation of the dollar. On the other hand, exports did not increase due to problems of commercial partners. Besides decreases in imports and exports of services such as international trips, which fell just like air transportation of passengers” Ms. Palis says.
Agriculture was the only sector to record increase in the annual comparison
In the annual comparison, GDP fell 3.9% in Q3 2020. Agriculture recorded a positive change of 0.4%, due to the output increase and gain in productivity of agricultural activity. The highlights are crops with relevant output in Q3, indicating increases in annual estimates: coffe (21.6%), sugarcane (3.6%), cotton (2.5%) and corn (0.3%). On the other hand, orange and lime crops, with significant harvests in the quarter, recorded decreases of 3.4% and 4.0%, respectively.
Industry fell 0.9%.Construction recorded a decrease in volume of value added (-7.9%), following the decrease of employment in this activity. Manufacturing industry recorded negative change of 0.2%, mainly due to decreases in Manufacture of wearing apparel, Manufacture of vehicles and Other transportation equipment, basic metals and machinery and equipment.
The services sector, which accounts for 73% of the GDP, fell 4.8% against the same quarter a year ago, with a highlight to decreases in Other service activities (-14.4%) and Transportation, storage and mailing (-10.4%). Decreases were also observed in: Administration, defense, public health and education and social security (-5.4%), Trade (-1.3%), Information and communication (-1.3%). The activities recording increases were Financial activities, insurance and related services (6.0%) and Real estate activities (2.7%).


