POF
Beans on the Brazilians' tables fall by half in 15 years


April 03, 2020 10h00 AM | Last Updated: April 07, 2020 05h44 PM
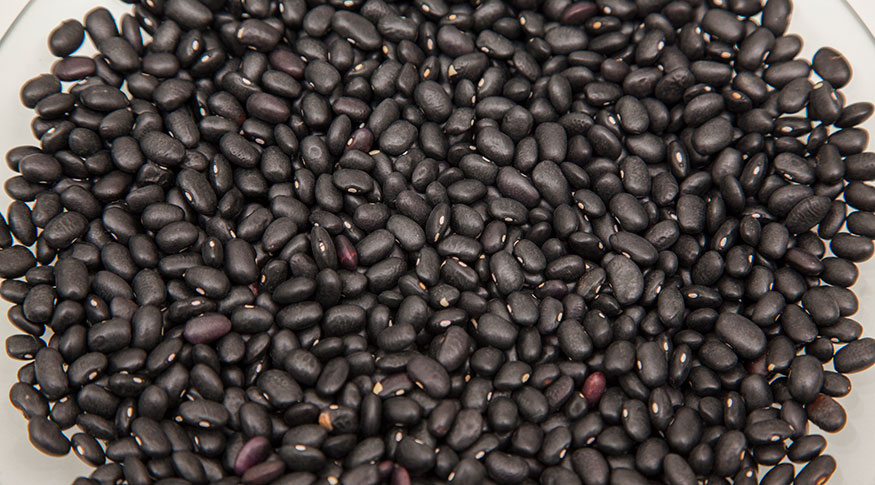
Rice and beans, a classic pair in the Brazilian diet, had a considerable reduction in the quantities acquired in household consumption. This is what a historical analysis of the Dietary Assessment of Household Food Supply module of the 2017/2018 Consumer Expenditure Survey (POF), released today (3) by the IBGE, shows. In 15 years, the average annual per capita amount of beans fell 52%, ranging from 12,394 kg in the 2002-2003 edition of the survey, to 5,908 kg in 2017/2018. The amount of rice fell 37% in that period, going from 31.578 kg to 19.763 kg.
For the survey analyst, José Mauro de Freitas, the fall in consumption of those two products is rather significant and might have multiple causes, like the increasing importance of food away from home and changes in eating habits. ‘Economic issues as price and income changes are also important and should be considered”, analyzes Mr. Freitas.
Although the survey indicates the fall in the consumption of those two products, Mr. Freitas highlights the importance of those items on the Brazilian tables. “It is also important to highlight that both rice and beans still contribute significantly to the calories available from fresh products acquired by Brazilian households. Rice, for example, contributes with 15.6% and beans, with 4.3%”, he explains.
Likewise, other products also had a relevant decrease. Cassava flour (2.332 kg per person/year), per example, dropped its average per capita consumption by 70% between the 2002/2003 and 2017/2018 POFs, meanwhile, wheat flour fell 56% in the same period. Those products recorded the highest decrease percentage. Milk reduced 42%, from 44.405 kg to 25.808 kg.

In this same period, the highlights in the increase of the per capita average quantity were eggs (94%), convenience food and industrial mixtures (56%) and alcoholic drinks (19%). For the IBGE researcher, the increase in egg consumption might be explained by the change in society perception about the food item, which, according Mr. Freitas, was not seen as healthy in the period of the2002/2003 POF.
“Whether scientific or not it is a whole other story. The fact is, since that period, the egg, at least for the general audience, stopped being avoided. From another perspective, eggs are a common substitute for animal protein when meat price rises. It is hard to say if it is an economic trade or a change in eating habits. This survey shows, and the data are clear, the egg consumption increased significantly”, says the researcher.
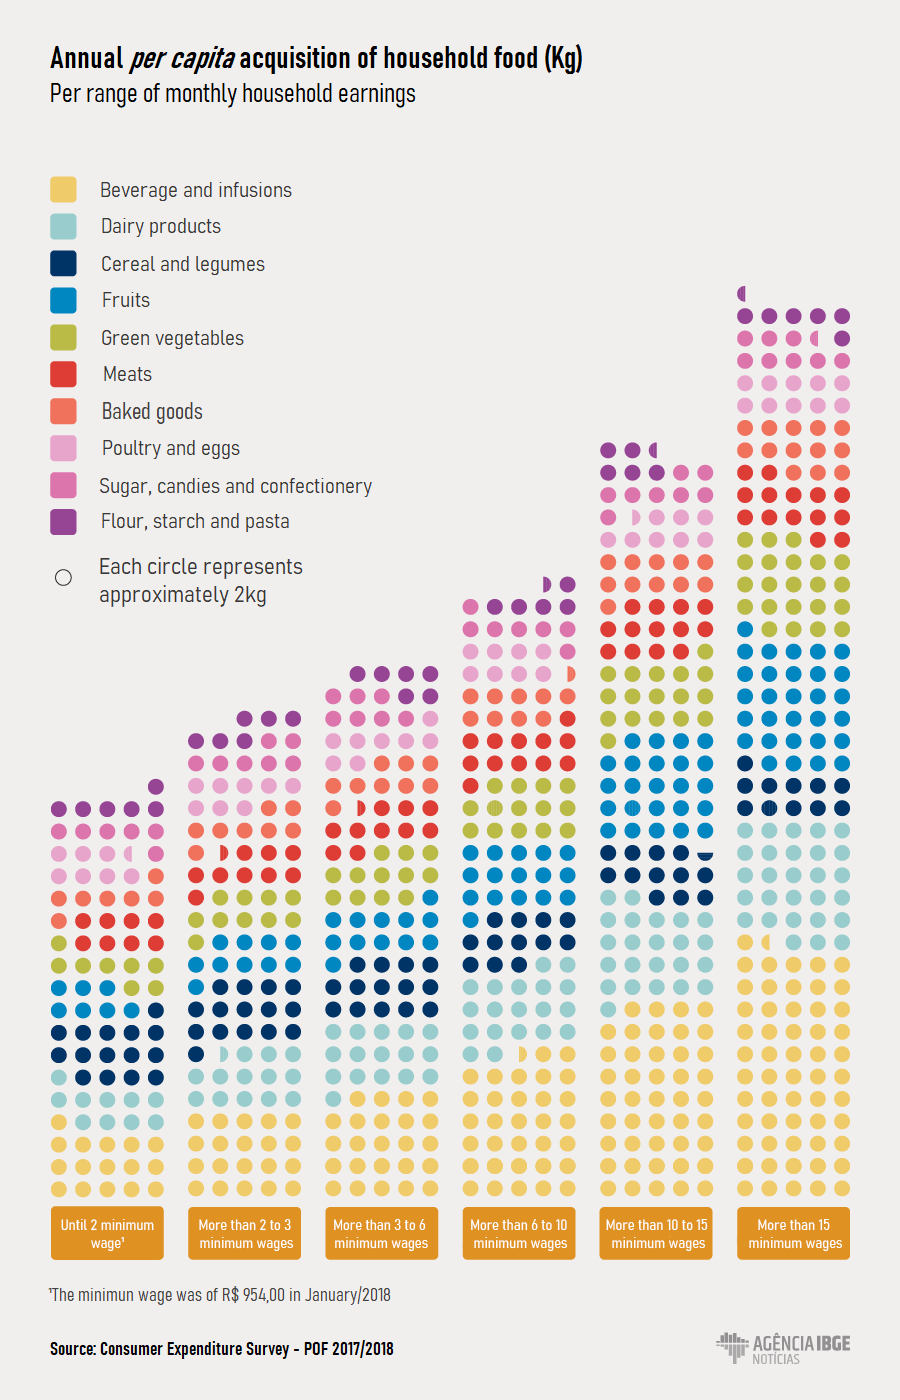
Highest income ranges buy 125% more fruits than national average
The survey also analyzes the quantity of consumed food at home according to divisions as, for example, the difference between urban and rural areas, Major Regions and income ranges.
In the analysis per income ranges, the groups of products that recorded averages than above the national average in the range of the lowest earnings were cereal and legumes (30.505 kg and 30.086 kg), flour, starch and pasta (12.897 kg and 12.245 kg) and fish (3.359 kg and 3.091 kg) . The average per capita intakein the range of the highest earnings surpasses 70% the national average in the groups dairy products (75%), green vegetables (87%), beverages and infusions (115%), fruits (125%) and convenience foods and industrial mixtures (187%).
South Region surpasses national average in 7 out of the 17 food groups
The South Region recorded averages above the national average and other regions’ averages for 7 out of the 17 groups, highlighting dairy products (48.271 kg), fruits (31.931 kg), green vegetables (31.333 kg) and meat (25.566 kg). Central-West was a highlight in the acquisition of meat (24.503 kg) and surpassed the national and other regions’ average in the group of cereal and legumes (32.661 kg).
Fish consumption was higher in the North, with average of 9.855 kg, surpassing the national average. Other groups that pointed out the highest averages in the North were poultry and eggs (19.907 kg), flour, starch and pasta (17.889 kg) and coconuts, chestnuts and pecan nuts (9.530 kg).
The Southeast region was a highlight in the average acquisitions of dairy products (38.449 kg), green vegetables (25.011 kg), baked goods (18.170 kg) and convenience foods and industrial mixtures (5.118 kg), all of them above the national average. In the Northeast, the highlights were beverage and infusion (67.517 kg) and cereal and legumes (31.906 kg). However, the region also recorded the lowest per capita acquisition of meats (18.664 kg), around 10% lower than the national average (20.762 kg).
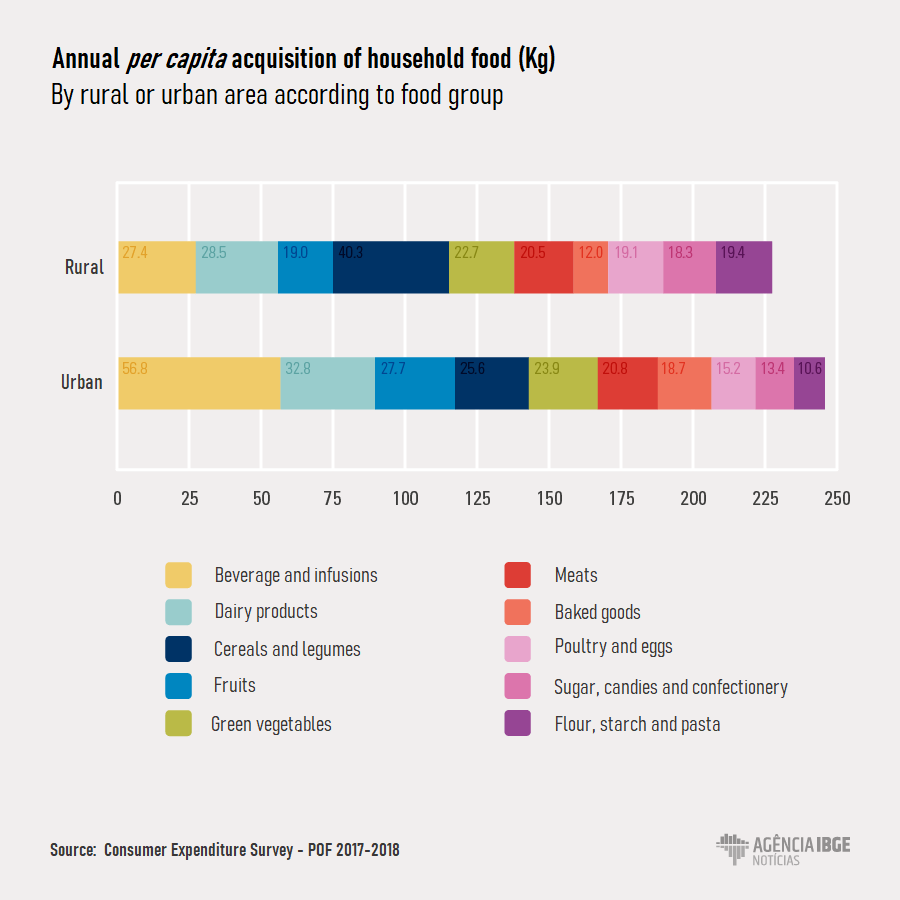
Rural areas consume more cereal and legumes than urban areas
Rural areas were a highlight in the acquisition of cereal and legumes (40.268 kg, about 45% higher than national average), flour, starch and pasta (19.390 kg), poultry and eggs (19.101 kg) and sugar, candies and confectionery (18.333 kg).
The group of fruits recorded an expressive difference between both areas: while in urban areas the acquisition was of 27.692 kg, about 5% higher than the national average, in rural áreas, it was of 19.026 kg, 28% lower than the national average.
In urban area, the acquisition of beverages and infusions (56.807 kg) was around 8% higher than national average and baked products was of 18.706 kg, about 6% higher than national average.