Summary of Social Indicators
Privately-owned housing units are the majority, but 13.5% of them have no documentation
December 06, 2023 10h00 AM | Last Updated: December 08, 2023 10h52 PM
Highlights
- The majority of the Brazilian population (64.6%) lives in privately-owned and fully paid off housing units. This percentage had dropped since the start of the time series, in 2016 (67.8%).
- Among the poorer population, the 20% with the lowest earnings, 65.4% live in this condition, a percentage above the 20% with the highest earnings (64.2%)
- The percentage of rented housing units increased from 17.3% in 2016 to 20.2% in 2022. Among the poorest population, the percentage reached 18.3%, 4.0 p.p. above the 2016 figure. Among the richest, the year 2022 hit 21.0%, 3.2 p.p. more than in 2016.
- In 2022, 13.6% of the persons living in privately-owned housing units, or 9.6% of the total population, had no documentation. This proportion dropped by 2.0 percentage points from 2019 (11.6%).
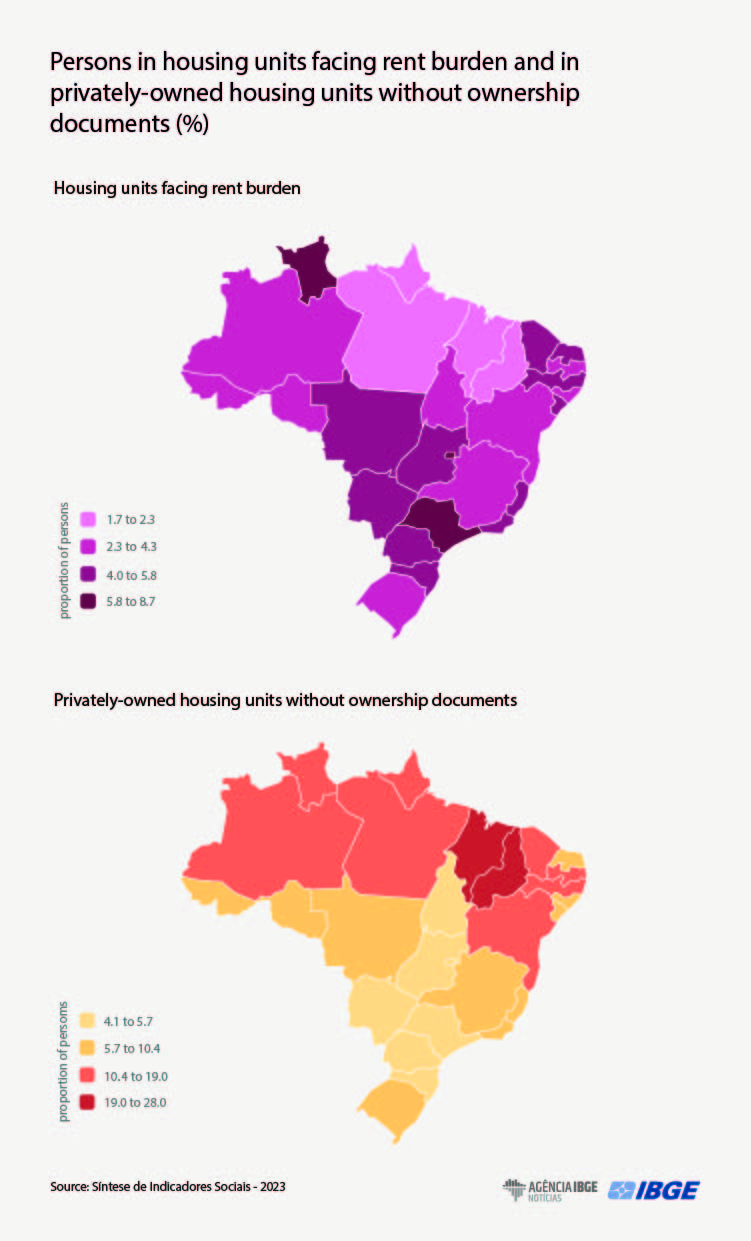
- Among the poorest, 18.5% were living in privately-owned housing units with no documentation.
- Rent burden affected 23.3% of the population living in rented housing units (4.7% of the total population). This aspect was a vulnerability more often observed among women without a partner and with a child of up to 14 years of age (14.2%), single-person arrangements (9.6%) and the poor population (9.7%).
- In the population with lowest earnings, 13.8% felt unsafe in their place of residence and 29.8%, in their neighborhood. These percentages were 6.9% and 25.1%, respectively, in the population with highest earnings.

About 64.6% of the Brazilian population lives in privately-owned and fully paid-off housing units, although this proportion has decreased since 2016 (67.8%). In the poorest population, those with the 20% lowest earnings, 65.4% live in this condition. Among the 20% with the highest earnings, the percentage was smaller: 64.2%. These data can be found in the Summary of Social Indicators, released today by the IBGE. More news abou the study can be found here, here and here.
The proportion of rented housing units increased from 17.3% in 2016 to 20.2% in 2022. Among the poorest population, the percentage of rented housing units was 18.3%, 4.0 p.p. above the figure recorded in 2016. Among the richest, it was 21.0% in 2022, 3.2% more than in 2016.
The proportion of “privately owned - being paid” housing units was lower in the population with the lowest earnings (2.9%) and more ofen observed among those with the highest earnings (10.2%). The proportion of “lent” housing units was higher among the poorest (13.4%) and lower among the richest (4.4%).
It is worthy of mention that per capita household earnings of the 20% poorest was R$271 in 2022, and that of the 20% richest, R$4,484.
In the poorest population, 18.5% lived in privately-owned housing units without documentation
The study also analyzed, in privately-owned housing units, the existence of documents of the property. In 2022, housing units of 13.6% of the persons lacked documents, a drop of 2.0 percentage pounts from 2019 (11.6%). “Non-existence of documents indicates these residents are vulnerable and unsafe regarding ownership of their properties,” Bruno perez, analyst of the survey, explains.
This condition recorded its highest proportions in the black or brown population (12.3%), women without a partner with a child up to 14 years of age (10.9%) and the population with the lwest earnings (18.5%).
Another inadequacy in housing conditions is rent burden, that is, when the amount spent on rent exceeds 30% of the household income. In 2022, that situation was faced by 23.3% of the population who lived in rented housing units, or 4.7% of the total population. Such vulnerability was mostly common among women without a partner and with a child up to 14 years of age (14.2%), those living in single-person arrangements (9.6%) and the population with the lowest income (9.7%).
Perez highlights that, alhough such inadequacies refer to lower earnings, their regional distribution is not the same: “The lack of documents to prove property ownership is related to the poor population in states with lowest earnings, rent burden is more common among the poor population of states with higher earnings.”

Feeling of unsafety in the place of residence is twice more common among the poorest population
The study also analyzed the feeling of safety in one’s own housing unit and in the neighborhood where it is located. Considering the population with lowest per capita household income, 13.8% reported feeling unsafe in their place of residence, and 29.8%, in their neighborhood. In the population with the highest earnings, the percentages were 6.9% and 25.1%, respectively. “The most significant difference occurs between percentages of feeling of unsafety. Among the poorest, the feeling of unsafety has a percentage two time above the richest ones.
Women and black or brown persons recorded the highest percentages of feeling of unsafety. Among black and brown women, 13.3% reported feeling unsafe in their housing unit, and 32.3%, in their neighborhood. White men, on the contrary, recorded figures of 7.7% and 20.9%.
The Federation Unit with the highest proportion of feeling of unsafety in the neighborhood in 2021 was Amapá (48.1%) and the lowest index was that of Santa Catarina (9.9%). Among the capitals, extreme figures as for feeling of unsafety were those of Teresina-PI (58.3%) and Florianópolis-SC (10.3%). “In all the states, the percentages of persons who reported feeling unsafe in their neighborhoods were higher in the capitals than in the state as a whole,” the researcher points out.
More about the survey
The Summary of Social Indicators: an analysis of the living conditions of the Brazilian population in 2023 aims to systematize and present a set of information related to the social reality of the country, based on structural topics of great relevance for the construction of a comprehensive framework on the living conditions of the Brazilian population.
This edition features indicators on economic structure and labor market, standard of living and income distribution; housing conditions and education. The analyses by population groups draw attention to earnings inequality, gender, color or race, age groups, urban or rural housing units and household arrangements, showing the evolution of indicators in the time series. The information presented refers to Major Regions, Federation Units and, for some indicators, capital municipalities.


