POF 2017-2018
Loss of quality of life is almost twice as much in rural areas


November 26, 2021 10h00 AM | Last Updated: November 29, 2021 05h10 PM
Highlights
- The loss of quality of life index (IPQV) in Brazil was 0.158 between 2017 and 2018. This value was 1.7 higher in rural areas (0.246) than in urban areas (0.143).
- North (0.225) and Northeast (0.209) showed the greatest losses in quality of life among the Major Regions. South (0.115) and Southeast (0.127), the smallest.
- In families where the household head was white, the index was 0.123, lower than that recorded in households whose heads were black or brown (0.185).
- The loss of quality of life among those with the lowest income (0.260) was more than four times higher than among the richest (0.063).
- Maranhão (4.897) had the lowest socio-economic performance index (IDS) in the country. The largest was registered by the Federal District (6,970).
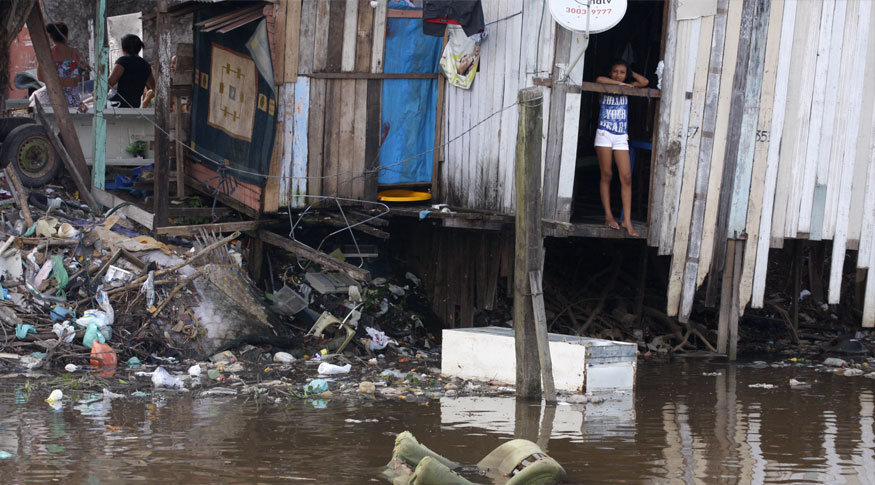
The loss of quality of life of people living in the rural areas of the country is almost twice as big as that of those living in urban areas. This is one of the conclusions of the module "Profile of Expenditures in Brazil: Quality of Life Indicators", of the 2017-2018 Consumer Expenditure Survey (POF), released today (November 26), and which brings two new indicators that measure the quality of life of the population. The study integrates a set of experimental statistics carried out by the IBGE.
The Loss of Quality of Life Index (IPQV) takes into account housing; access to public utility services; health and food; education; access to financial services and standard of living; transportation and leisure. The indicator ranges from 0 to 1 and the closer to zero, the better the quality of life.
Between 2017 and 2018, the index was 0.158 for the country. In the urban area, the index was 0.143, whereas in the rural are, it was 0.246. It means that in the rural area, where nearly 15% of the country’s population lives, the loss was 1.7 bigger than in the urban area.
“The indicators show interesting aspects that are invisible when we just focus on income, especially in terms of the differences among the dimensions. The IPQV, for instance, indicates that in the rural areas the loss of quality of life is higher and, therefore, their contribution is quite big (22.9%) to the result of Brazil”, says the survey analyst, Mr. Leonardo Oliveira.
The North (0.225) and Northeast (0.209) are the regions that presented the highest loss of quality of life. While the South (0.115) and Southeast (0.127) had their IPQV bellow the national one. Central-West reached 0.159. “This is the third dissemination of the series "Profile of Expenditures in Brazil". Based on the results of the two previous editions, we could already identify more concentrated losses in the North and Northeast, but we could not measure with accuracy the proportion of such deprivation. The IPQV presents those data concretely”, he explains.
Although the Northeast has 35% fewer population than the Southeast, it contributes proportionally more (35.9%) than the Southeast (33.8%) to the national result. “The Northeast has 27.3% of the population of the country and is the second biggest IPQV among the regions. As a consequence, its contribution to the result seen for Brazil is higher, as it has a large population and a relatively high index”, says Mr. Oliveira.
In the households with male heads, the IPQV was 0.151, a lower value than that of households with a female head (0.169), which stands above Brazil’s index. On the other hand, in the households where the head self-declared as white, the index was of 0.123, lower than that recorded in households with a black or brown head (0.185).
It means that the loss of quality of life of the groups in which the household head is black or brown is practically 50% above what is seen for the group in which the household head is white. It is not a small difference, since it makes the group of black or brown heads concentrate 66% of the losses reported in Brazil”, he says.
The difference is even bigger when the deciles of income are considered. Among the 10% with the lowest income, the IPQV was 0.260, the highest of this cohort. Conversely, for the last decile, i. e., those earning the highest income, the value was of 0.063. That means the loss of quality of life among those with the lowest income was more than four times higher than that of the highest income group.
Despite the fact the highest incomes are related to the lowest levels of loss of quality of life, the IPQV did not reach zero among those with the highest incomes. “Even for the very high levels of income, the losses are not fully eliminated. That indicates there are other factors that improve the quality of life. It is also possible to observe that there are people, among the 10% with the lowest incomes, with loss levels quite below of the IPQV of the decile that they belong to”, says the analyst.
“That is, despite not having such a high income, they are able to eliminate part of the losses. That depends on may factors, as local policies, such as the school their children go to. When there is access to health services, the IPQV is reduced. The indicators is able to capture the improvements in several dimensions that go beyond income”, he exemplifies.
The loss of quality of life was also bigger in households whose heads had poor schooling. Among uneducated ones, the IPQV was of 0.255. The level goes down as schooling goes up, reaching 0.076 when the household head has complete higher education.
Another aspect to be seen is the loss of quality of life related to employment. In that cohort, the IPQV had the lowest value (0.093) when the head was an employer and the highest value (0.203) when the head was a domestic worker.

Maranhão has the highest IPQV and lowest IDS
The Socio-Economic Performance Index (IDS) is the indicator that presents the capacity society has to generate resources and transform them into quality of life. Brazil’s IDS, between 2017 and 2018], was 6.201. Among the Federation Units, the Federal District (6.970) and São Paulo (6.869) recorded the highest values.
“This indicator complements the information of income with the IPQV. Thus, there is a measure that can be used to compare the several Federation Units to identify which of them has the highest performance. It is also possible to identify in which dimensions the losses are concentrated and where the performance can be improved”, explains he.
All the states of the North and Northeast stood below the national average. Even recording the highest IDS among the northeastern states, Sergipe (5.879) stood 5.2% below the Brazilian average. The same goes to Roraima (5.874), which had the highest index among the northern states, but did not surpass the national average.

Maranhão, besides having the highest IPQV (0.260), has the lowest IDS (4.897) of the country. Pará (5.099) comes in second in this indicator. “In the Federal District and in São Paulo, the highest concentrations of losses are in Transportation and leisure, which is different from what happens in the states with the lowest IDS values of the country. Although they also have losses in this dimension, these states have more concentrated losses in other dimensions. In Pará, for instance, they are more related to access to public utility services.”
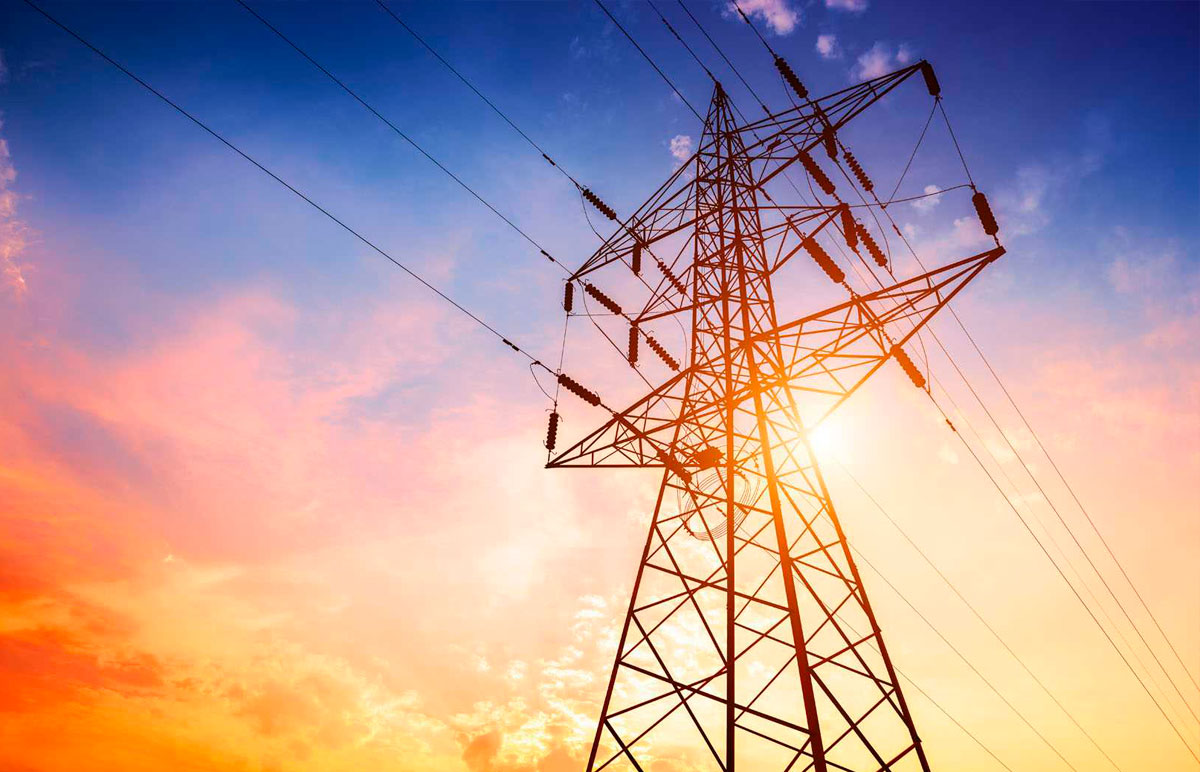
The dimension called "access to public utility services" includes the services of electricity, water, sewage and waste collection. “Residents also evaluate the services available to them. So, when the residents indicate the absence of any services or evaluate them as precarious, this counts as loss of quality of life”, explains Mr, Oliveira.
In Maranhão, the losses were more concentrated in the Access to financial services and standard of living, besides access to public utility services. “If nobody in the household has access to a bank account, it counts as a loss in that dimension. Durable goods in the household, as stove, refrigerator, microwave oven and TVs, are also counted in this dimension. Some of those items are important because they spare people's time spent in domestic chores, giving them time to do some other activities”, he claims.