GDP of Municipalities
Nearly half of Brazilian GDP was concentrated in 71 municipalities in 2018
December 16, 2020 10h00 AM | Last Updated: December 21, 2020 04h04 PM
Highlights
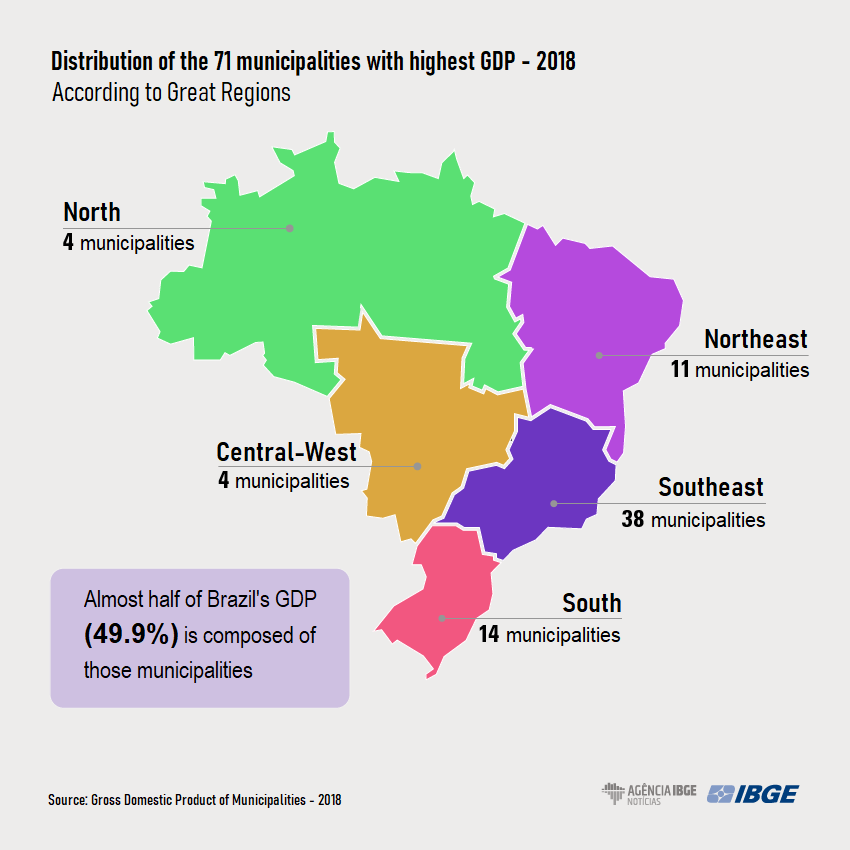
- Nearly half of the GDP in 2018 was produced by 71 municipalities, which corresponds to only 1.3% of the 5,570 Brazilian cities.
- In 2018, eight municipalities added up to nearly 25% of the national GDP.
- Among the 25 municipalities with the highest GDP, 12 were capitals.
- Between 2002 and 2018, the share of the 100 municipalities with the highest GDP reduced from 60% to 55%.
- Maricá, Niterói and Campos dos Goytacazes, municipalities of the state of Rio de Janeiro, gained more share in the GDP. São Paulo and Osasco (SP), the biggest losses.
- The city-region of São Paulo, which comprises 92 municipalities with strong economic integration with the metropolis, concentrated 24% of the national GDP.
- Presidente Kennedy, in Espírito Santo, registered the highest per capita GDP in 2018 in Brazil.

Nearly half of the Brazilian Gross Domestic Product - GDP in 2018 was produced by 71 municipalities, which corresponds to only 1.3% of the 5,570 Brazilian cities where one third of the population lived. However, the concentration of the economy in few cities has been reducing, as shown in the GDP of the Municipalities 2018, released today (16) by the IBGE.
"The increase in the number of municipalities between 2002 and 2018 allows to pinpoint a deconcentration trend, with municipalities with lower GDP gaining share in relation to those with higher GDP. In 2002, 48 municipalities concentrated nearly half of the GDP (49.9%). In 2018, 71 municipalities were required to reach the same percentage," explains Luiz Antônio de Sá, a National Accounts analyst.

The deconcentration can be seen in other divisions. In 2018, eight municipalities added up to nearly 25% of the national GDP: São Paulo (SP) with 10.2%; Rio de Janeiro (RJ) with 5.2%; Brasília (DF) with 3.6%; Belo Horizonte (MG) with 1.3%; Curitiba (PR) with 1.2% and, with 1.1% each, Manaus (AM), Porto Alegre (RS) and Osasco (SP). In 2002, only four municipalities held one fourth of the national economy.
Among the 25 municipalities with the highest GDP in 2018, 13 were non-capitals and 12, capitals. Compared with 2017, Belém (PA) lost its ranking position to Niterói (RJ). Among those that were not capitals, all of them were in the Southeast Region: ten from São Paulo, two from Rio de Janeiro and one from Minas Gerais.
"in 2018, the municipalities of the capitals represented 31.8% of the national GDP, the smallest participation in the time series started in 2002. The city of São Paulo had the biggest share (10.2%) and Rio Branco, in Acre, ranked in the last position among the capitals, with a contribution of 0.1% among the capitals," details the IBGE analyst.
The share of the 100 municipalities with the biggest GDPs also reduced between 2002 and 2018, from 60% to 55.0%. In the annual comparison, the drop in the concentration was of 0.3 percentage points in relation to 2017, when the share was 55.3%. Three capitals were not included in the list of the 100 biggest GDPs: Boa Vista (RR), in the 105th position; Palmas (TO), in the 116th position; and Rio Branco (AC), in the 127th position.
Petroleum extraction leverages share gain of municipalities in GDP
Maricá, Niterói and Campos dos Goytacazes, all of them in Rio de Janeiro, registered the biggest share gain in the Brazilian GDP (0.2 p.p.) in 2018, caused by petroleum extraction, which was benefited from the increase in the international prices of that commodity that year. Ilhabela, in the shore of São Paulo, advanced 0.1 p.p. due to the same reason.
The capitals Vitória and Rio de Janeiro also gained 0.1 p.p. of share in the GDP, due to ore extraction and tax collection, net of subsidies, on products, respectively.
On the other hand, the biggest drops in the share occurred in São Paulo and Osasco, mainly due to financial activities, insurance and related services, since the interest rate was reduced in 2018 and this activity weights the most in both municipalities.
Maricá was the municipality that mostly gained share in the 2002-2018 period, an increase of 0.4 p.p. due to petroleum extraction.
São Paulo (-2.5 p.p.) and Rio de Janeiro (-1.1 p.p.) recorded the biggest drops in share in 16 years, which reinforces the deconcentration trend of the GDP at municipal level. The reduction in São Paulo was influenced by the relative decrease of financial activities. In Rio de Janeiro, the loss came from the decrease of its weight in the Brazilian industry.
Marcelo Delizio, an IBGE geographer, states that although the major economies are continuously losing share in the national GDP to smaller municipalities, there is still a high concentration in the income generation in Brazil.
"It becomes clear when we notice the distribution of the GDP along urban concentrations, which are municipalities or population arrangements with more than 100 thousand inhabitants and that show a high degree of integration due to commuting for work and study. The urban concentrations of São Paulo (16.8%) and Rio de Janeiro (8.1%), together, account for 25% of the GDP," explains Delizio.
City-region of São Paulo concentrates 24.0% of the national GDP
The geographer notes that such inequality is even more evident when the city-region of São Paulo, a geographic stretch in which 92 municipalities have a strong economic integration with the metropolis and concentrated 24.0% of the GDP in 2018, is compared with the Semiarid (5.2%) and Legal Amazon (8.8%).
Such difference remains even after a drop of 2.9 p.p. in the share in the Brazilian GDP by the city-region of São Paulo between 2002 and 2018. At the same time, the Legal Amazon and the Semiarid gained a share of 1.8 and 0.7 p.p. in the period, respectively.
"The Semiarid has more than 1,200 municipalities and the Legal Amazon, more than 700. They are regions with very complex socioeconomic characteristics. In contrast, the city-region of São Paulo, which has quite less municipalities, is quite integrated and stands out in nearly all the economic activities, even in agriculture," tells Marcelo Delizio.
In agriculture, highlights the geographer, the rural area of the metropolis of São Paulo registered the sixth biggest value added in Brazil in 2018, reaching R$8.9 billion with the production of "other products from temporary crop", i.e., vegetables and fruits for the consumption of urban areas. Therefore, they are not products for exports.
"This region reaches the same production value with legumes and vegetables of other large areas in Brazil producing soybeans and sugarcane, destined to exports," adds the geographer.
Presidente Kennedy (ES) has the highest per capita GDP in Brazil
The IBGE data also show that, in 2018, the ten municipalities with the highest per capita GDPs added up to 1.5% of the national GDP and 0.2% of the population. Presidente Kennedy, in Espírito Santo, had the highest per capita GDP in Brazil (R$583,171.85), followed by Ilhabela (SP), both due to petroleum extraction.

Among the municipalities of the capitals, the leader was Brasília, with R$85,661.39, i.e., the per capita GDP of the federal capital was 2.5 higher than the national per capita GDP (R$33,593.82). Ten capitals had a per capita GDP higher than the national one. In 2002, this figure was higher (11 capitals). The smallest position was occupied by Belém (R$21,191.47).


