Continuous PNAD
Persons with disability have less access to education, work and income
July 07, 2023 10h00 AM | Last Updated: July 10, 2023 02h43 PM
Highlights
- Nearly 18.6 million persons aged 2 years and over in Brazil (or 8.9% of this age group) had some type of disability. The data are from the Persons with disability module of the 2022 Continuous PNAD.
- In 2022, 47.2% of persons with disability were aged 60 years and over. Among the persons without disabilities, only 12.5% were within this age group.
- In the third quarter of 2022, the illiteracy rate for persons with disability was 19.5%, whereas that among persons without disability was 4.1%.
- Only 25.6% of the persons with disability completed at least the secondary education, whereas 57.3% of the persons without disability had tis level of schooling.
- The participation rate in the workforce of persons without disability was 66.4%, whereas that among persons with disability was only 29.2%. Inequality persists even among persons with higher education: in this case, the participation rate was 54.7% for persons with disability and 84.2% for those without disability.
- The employment-population ratio of persons with disability was 26.6%, less than half of the percentage found for persons without disability (60.7%).
- Nearly 55.0% of the persons with disability who worked were in the informality, whereas this percentage was 38.7% for employed persons without disability.
- The average usual real earnings of employed persons with disability was R$1,860, whereas earnings for employed persons without disability was R$2,690.
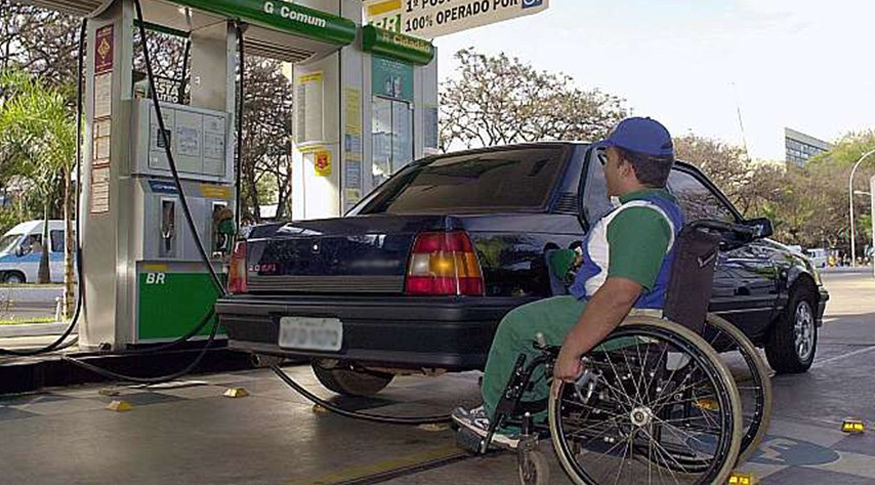
The population with disability in Brazil was estimated at 18.6 million persons aged 2 years and over, which corresponds to 8.9% of the population in this age bracket. The data are from the Persons with disability module of the 2022 Continuous PNAD. This theme has already been investigated in other IBGE surveys, being the 2010 Population Census and the National Survey of Health (PNS) 2013 and 2019 the most recent ones. However, the data are not comparable among the surveys, due to methodological differences.
“The questionnaires have been following the evolution and the adaptation of models to understand disabilities, following the international recommendations from the Washington Group on Disability Statistics, the International Classification of Functioning, Disability and Health, and in accord with the Convention on the Rights of Persons with Disabilities and the Brazilian Law of Inclusion of Persons with Disability,” explains Maíra Bonna Lenzi, an analyst of the survey.
The questionnaire aims at raising the difficulties to accomplish several types of functional activities. There are four categories of answers, from ‘Doesn´t have any difficulty’ to ‘Has it, but cannot do at all’. The identification of persons with disability is established by those who answered either to have much difficulty or cannot do it all.
“It provides an indicator that better represents those who will really face barriers. Including this theme in the Continuous PNAD means having information on education and labor market for those persons and, thus, managing to plan policies that foster quality of life, greater participation in the society and equalization of opportunities between persons with disability and the others,” highlights the analyst. She also clarifies that the data on persons with disability were collected in the third quarter of 2022. Every information on education and labor market refer to that period as well.
Difficulty to walk or climb stairs (3.4%) was the most frequent in the Brazilian population
Concerning the difficulties investigated, walking or climbing stairs was the most declared (3.4%), followed by seeing, even using glasses or contact lens (3.1%); learning, reminding things or concentrating (2.6%); lifting a bottle with two liters of water from the waist until the eyes level (2.3%); grasping small objects or opening and closing recipients (1.4%); hearing, even using hearing aids (1.2%); taking personal care (1.2%); communicating, to understand and being understood (1.1%). In addition, 5.5% of persons were impaired in only one function and 3.4%, in two or more functions.
The profile of the persons with disability was higher among women (10.0%) than among men (7.7%) and slightly higher in black persons (9.5%), against 8.9% among brown persons and 8.7% among white persons. Including 5.8 million persons in this condition, the Northeast was the region with the highest percentage (10.3%), followed by the South (8.8%), Central-West (8.6%), North (8.4%) and Southeast (8.2%).
The survey unveiled that the percentage of persons with disability grows with age. In 2022, 47.2% of persons with disability were aged 60 years and over. Among the persons without disabilities, that age group represented 12.5%. That pattern is repeated in all the Major Regions, highlighting the South and Southeast regions, in which more than half of the persons with disability were seniors.

The types of impairment also changed according to the age group. In the childhood, among children aged between 2 and 9 years, it is noticed that the biggest difficulties were communicating, to understand and being understood (1.3%), as well as learning, reminding things or concentrating (1.2%).
Between 40 and 49 years, difficulties to see (2.9%) became more evident. At the age of 50 years, the percentage of persons with disability in several types of impairments increases. Between 60 and 69 years, difficulty to walk or climb stairs (8.1%) prevailed, which, in turn, registered an even more relevant percentage for the group aged 80 years and over (33.5%).

Only one out of four persons with disability completed mandatory basic education
The illiteracy rate for persons with disability was 19.5%, whereas that among persons without disability was 4.1%. The illiteracy rate of this group also reflects regional inequalities: the Northeast has the highest rate (31.2%) and the South, the lowest (12.7%).
Most persons aged 25 years and over with disability did not complete basic education: 63.3% were uneducated or had incomplete basic education and 11.1% had either completed basic education or incomplete secondary education. For persons without disability, these percentages were 29.9% and 12.8%, respectively.
While only 25.6% of the persons with disability completed at least the secondary education, more than half of persons without disability (57.3%) had this level of schooling. The proportion of persons with higher education was 7.0% for persons with disability and 20.9% for those without disability.

Less than 15% of youngsters aged between 18 and 24 years with disability attended higher education
The schooling rate was lower among persons with disability in all the age groups. Of children aged between 6 and 14 years with disability, 95.1% attended school, below the rate of 99.4% of those without disability. Among youngsters aged between 15 and 17 years, the schooling rate for those with disability was 84.6% against 93.0% among those without disability. For the group aged between 18 and 24 years, the rate was 24.3% and 31.8% for persons with and without disability, respectively.
Inequality is even bigger whenever the school lag issue is considered, observed through the adjusted net attendance rate, which takes into account the schooling age-phase suitability. For the group aged between 6 and 14 years with disability, 89.3% attended primary education against 93.9% among those without disability. Slightly more than half (54.4%) of youngsters aged between 15 and 17 years with disability attended secondary education against 70.3% of youngsters without disability. In the group aged between 18 and 24 years, 14.3% of youngsters with disability were attending higher education against 25.5% of those without disability.
According to Lenzi, “this indicator is very important to understand why many children with disability are out of school. For example, we have the Brazilian Inclusion Law, which ensures that every child has accessibility resources to maximize their development and skills, mitigating the barriers. So, it is interesting to investigate what is missing to provide opportunities to those children and youngsters.”
Only 29.2% of persons with disability were in the workforce
The survey also analyzed the profile of persons with disability from the major labor market indicators. In 2022, 5.1 million persons with disability were in the workforce and 12 million, out of the workforce in Brazil.
The participation rate in the workforce among persons without disability was 66.4% in 2022, whereas it significantly drops to 29.2% among persons with disability. The Central-West Region registered the highest percentage of persons with disability in the workforce (35.7%), followed by the North (35.1%), South (29.6%), Southeast (28.5%) and Northeast (26.8%).
The age bracket of the persons with disability with the highest participation rate in the workforce was between 30 and 49 years (55.3%). The group aged between 14 and 29 years (43.9%) surpassed that aged between 50 and 59 years (42.6%). Among the seniors (aged 60 years and over), the rate was 10.2%. “The biggest differences between the rates of persons with and without disability occurred in the groups aged between 30 and 49 years and between 50 and 59 years,” highlights Lenzi.
Even with higher education, participation in workforce remains very unequal
Nearly 18.9% of the persons with disability either without education or with incomplete basic education were in the workforce, 29.1 p.p. below that noticed among persons without disability. Among persons with higher education, the difference was similar (29.5 p.p.), though at higher rates: 54.7% for persons with disability and 84.2% for those without disability.
“For the population with disability, a higher level of schooling, like higher education for example, was not sufficient to deduce the difference in the participation in the workforce in relation to persons without disability,” concludes the analyst.
Of four persons with disability at working age, only one was employed
Of the 99.3 million employed persons in Brazil in 2022, 4.7% were persons with disability. Among employed women, 5.4% had disabilities and, among men, 4.1%. Although it has the biggest contingent of persons with disability employed (1.8 million persons), the Southeast was the region with the lowest participation (4.0%). The North (5.7%) and Northeast (5.7%) recorded the highest participations of persons with disability in th the total number of employed persons.
The employment-population ratio, percentage of employed persons in the population at working age, was 26.6% for persons with disability and 60.7% for persons without disability.
Concerning color or race, the employment-population ratio of black persons with disability (31.2%) was higher than that for brown (27.4%) and white persons (24.4%). The biggest difference of employment-population ratios of persons with and without disability was among white persons (38.2 p.p.).
When analyzing information concerning the employment-population ratios of persons with disability according with the type of functional difficulty, persons with difficulty to accomplish personal care had the lowest employment-population ratio (3.8%). The highest one was among those with difficulty to see, even using either glasses or contact lens (30.9%).
51.2% of persons with disability with higher education were employed
The analyst highlights: “the data show that the employment-population ratio of persons with disability was always lower than that of persons without disability, even if at the same level of schooling.
The level of schooling with the highest difference was that of no education or incomplete basic education (31.2 p.p.). The difference has high (29.6 p.p.) even for higher education. In other words, schooling was not sufficient to balance their condition in relation to persons without disability in the labor market. “It is interesting to reflect on the the reasons that prevented those persons with a high level of schooling to be in the labor market,” questions the analyst.

More than half (55.0%) of those employed with disability were informal workers.
Concerning employment type, the highest percentage of employed persons with disability was as employees in the private sector (35.4%) and as self-employed (36.5%). It should be highlighted the steep difference between self-employed men with disability (41.9%) and without disability (29.0%). “We perceived that the self-employed type is significantly relevant for persons with disability to be inserted in the labor market,” states Lenzi.
The participation of women with disability as self-employed was 31.0% and that of women without disability was 20.4%. For women, the participation in the domestic work was also higher among women with disability (18.8%) than without disability (12.2%).
More than half (55.0%) of the employed population with disability was in the informality, whereas the percentage for persons without disability was 38.7%, a difference of 16.3 p.p.
Earnings from labor of persons with disability is 30% lower than the average for Brazil
The average usual real earnings per month related to the main job of persons with disability was R$1,860, the equivalent to 70% of the average earnings for Brazil (R$2,652), whereas earnings of persons without disability was R$2,690, 1.4% above the national average.
Men with disability (R$2,157) earned nearly 27% less than men without disability (R$2,941). The difference was steeper among women with disability (R$1,553), who earned nearly 34% less than those without disability (R$2,347).
The difference between earnings of men and women gets steeper in the group of persons with disability: R$604 more for men. For persons without disability, the difference is R$594 more for men. On the other hand, women without disability earn, on average, R$190 more than men with disability.
In all the activity groups, earnings of persons with disability were lower than those of persons without disability. The lowest percent differences of earnings were in Transportation, storage and mailing (10.5%) and Domestic service (12.6%). In the sectors with the highest earnings, like Information, communication and financial, real estate, professional and administrative activities and Public administration, defense, social security, education, human health and social services, the differences between earnings of persons with and without disability were around 30%.


