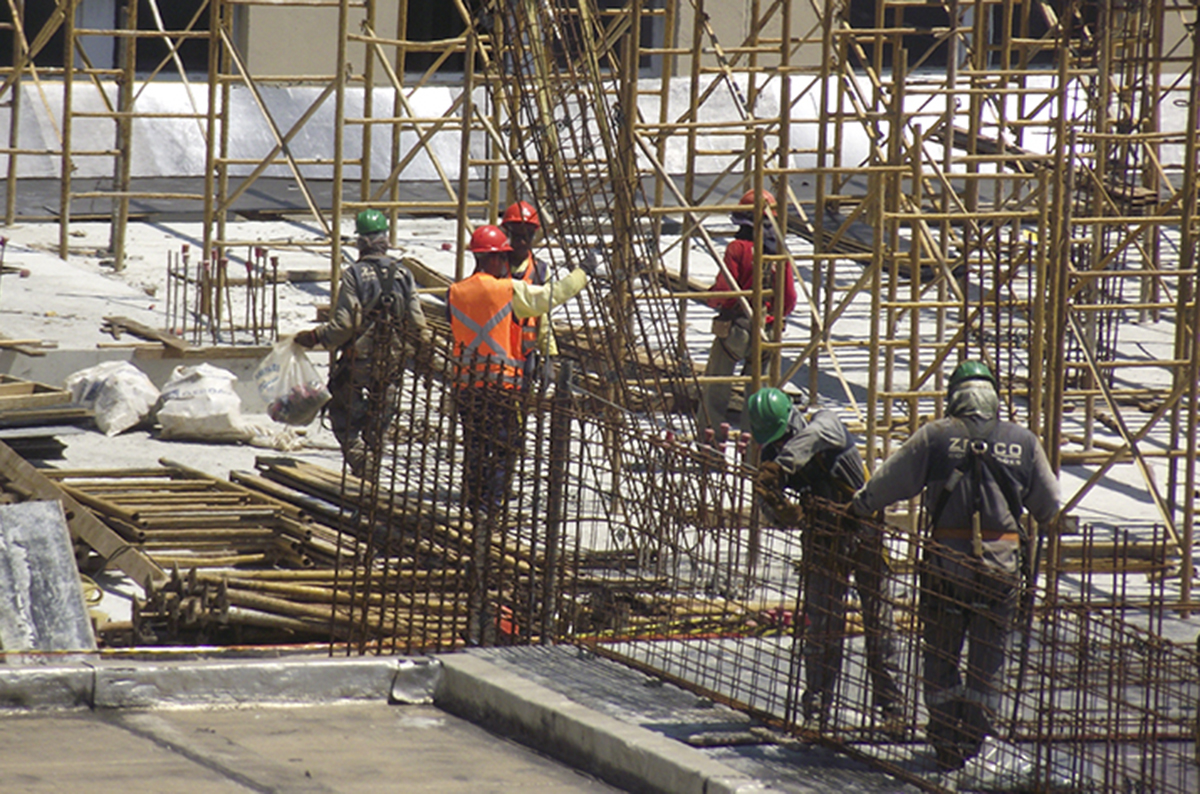
Domestic industry
Industrial production falls 0.4% in September and closes Q3 with 1.1% decrease


November 04, 2021 09h00 AM | Last Updated: November 04, 2021 03h03 PM

Industrial production fell 0.4 from August to September. It is the fourth drop in a row, accumulating a loss of 2.6% in the period. As a result, the industry stands 3.2% below the level of February 2020, in the pre-pandemic scenario, and 19.4% below the record level, registered in May 2011. These are the results of the Monthly Survey of Industry - PIM, released today (November 4) by the IBGE. The sector accumulated an expansion of 7.5% in the year and of 6.4% over the last 12 months. After having recorded increase since the fourth quarter of 202, in the third quarter of 2021, the industrial production had decrease fo 1.1%, in the comparison with the same quarter a year ago.
The survey manager, Mr. André Macedo highlights, that unlike what had happened in the previous months, in September there was no predominance of negative rates among the activities surveyed by PIM. “There was production decline in seven of the nine month this year. September differs from the other months because of the concentration of the retraction in few activities. However, it does not necessarily mean that there are changes in the prevalence of the negative behavior, since it is still very much characterized by the loss of dynamism”, he explains.
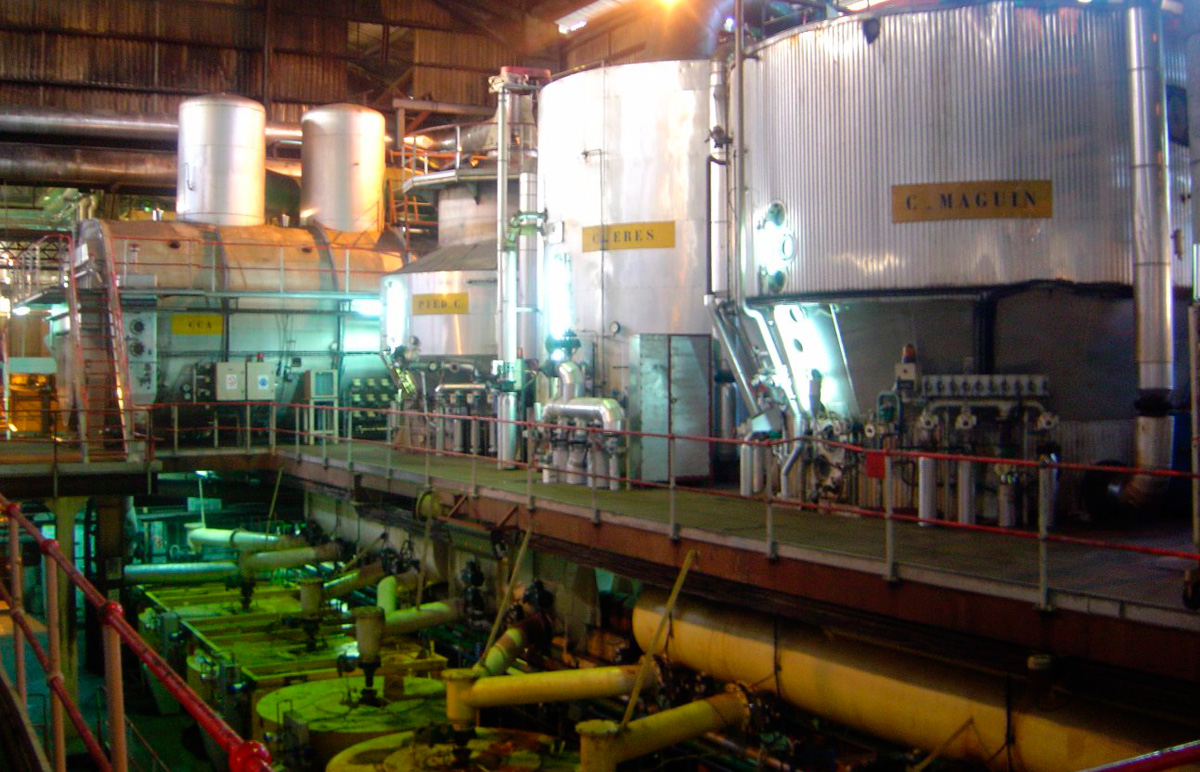
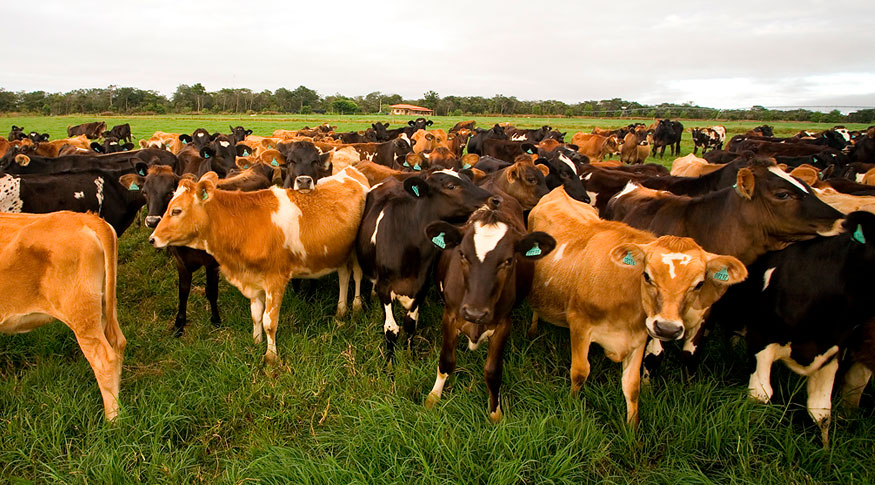
Ten of the 26 activities had negative results. Among them, the greatest impacts on the general index of September came from food products, which retreated 1.3% and from basic metals (-2.5%). “We can see negative signs in important segments in the sector f food, as the part related to sugar, due to the adverse weather conditions that affected sugarcane crops. Another sector whit a negative behavior was that of beef, due to the export suspension of the product to China in the beginning of September because of the ‘mad cow fever’. Thar exerted a negative impact on the food sector”, says Mr. Macedo. Therefore, the segment is now 7.4% below the pre-pandemic level.
The researcher highlights that this scenario is different from that of the basic metal sector, which advanced 0.4% in August and came back to negative rates in September. “Even with the drops of September, which surpassed August’s growth, the segment is 8.6% above the pre-pandemic level. Both basic metals and food products pose an important weight in the context of the industrial production and explain the concentration of few activities with a negative behavior,” he claims.
Besides those sectors, drops were also found from August to September in the segments of leather, traveling goods and footwear (-5.5%), other transportation equipment (-7.6%), beverages (-1.7%), mining and quarrying (-0.3%), furniture (-3.7%) and computer, electronic and optical products (-1.7%).
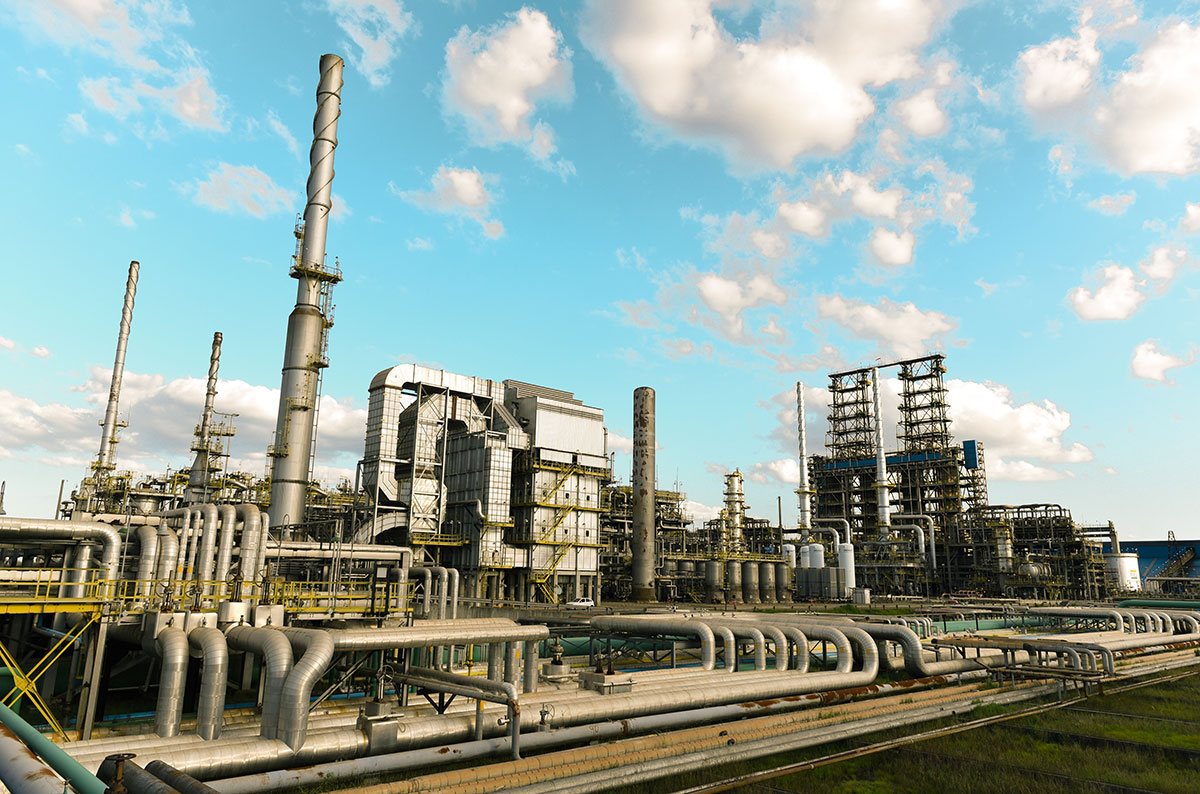
Among those on the rise, the highlights were pharmaceutical products (6.5%), other chemicals (2.3%), coke, petroleum products and biofuels (1.0%) and machinery and equipment (1.9%). The other highs were in pulp, paper and paper products (1.2%), electrical machinery and apparatus (1.7%) and tobacco products (6.6%).
The category capital goods had the sharpest negative rate (-1.6%0 and intensified the loss of 1.2% recorded in August. Durable consumer goods (-0.2) and intermediate goods (-0.1%) also retreated in the period whereas capital goods (15.0%) was the only major economic category to advance.
Industrial output retreats 1.1% in third quarter
By falling 1.1% in the quarter closed in September, the industrial sector interrupted a positive behavior that had been recorded since the last quarter last year (3.4%). According to Mr. Macedo, the change is due to the pace decline in the four major economic categories.
“There was a sequence, in terms of quarters, of positive results. IN the second quarter this year there was even an expansion that was a highlight (22.7%), explained by a very low base of comparison. The return to the negative scope is due to the results seen in all economic categories, especially of the segment of durable consumer goods, which leaves a three-digit growth to reach a decrease of 16.9%”, explains the researcher, emphasizing the retractions of cars and house appliances in the sector.
Industry declines 3.9% over September 2020
In the comparison with September last year, the industrial production fell 3.9%. The negative results achieved three of the four major economic categories and 18 of the 26 segments surveyed. The mains negative influences among the activities came from food products (-11.9%), motor vehicles, trailers and bodies (-7.9%), coke, petroleum products and biofuels (-4.6%) and computer, electronic and optical products (-18.7%)
“This result is much sharper than the -0.7% of August. There is a base of comparison effect. As the year advances, the 2020 base of comparison increases. But there is also a direct relation with the lower dynamism that the industrial sector has been showing”, highlights Mr. Macedo.
Among the activities that recorded increase, the highlights are: machinery and equipment (14.5%), basic basic metals (10.0%) and mining and quarrying (3.2%) The segment of printing and reproduction of recorded media (61.5%) also exerted a positive impact.
More on the survey
PIM Brazil has been producing short-term indicators since the 1970s regarding the behavior of the real product of the mining and quarrying and manufacturing industries. From May 2014, the release of a new series of monthly industrial production indices began, after a reformulation to: update the sample of activities, products and respondents; prepare a new weighting structure for the indices based on the most recent industrial statistics, in order to harmonize with the needs of the implementation the National Accounts Series - reference 2010; and to adopt the new classification of activities and products used by other industry surveys from 2007 onwards, namely: the National Classification of Economic Activities - CNAE 2.0 and the List of Industrial Products - PRODLIST-Industry.
The results of the survey can also be consulted in the Sidra database.