POF
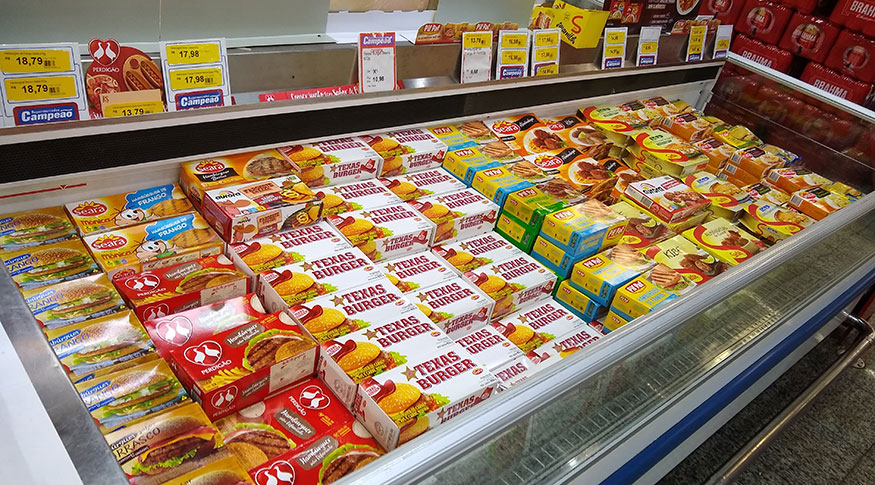
Ultra-processed food products advance and account for 18.4% of calories consumed at home
April 03, 2020 10h00 AM | Last Updated: April 24, 2020 01h54 PM

The availability of fresh or minimally processed food or processed cooking ingredients in Brazilian households has lost ground to processed food and, above all, ultra-processed food, in 15 years. The conclusion is part of the Dietary Assessment of Household Food Supply of the Consumer Expenditure Survey (POF) 2017/2018, released today (3) by the IBGE.
When comparing the evolution of food acquisition from the surveys released by the Institute, ultra-processed foods rose from 12.6% in 2002/2003, to 16% of the total calories in 2008/2009, achieving 18.4% in the last survey, an increase of nearly six percentage points in this period.
The evolution of acquisition natural or minimally processed food was of 53.3% of total calories in the 2002/2003 POF, decreasing to 50.4% in 2008/2009, and reaching 49.5% at the present. These data reflect the household food availability calculated per calories and not the personal food consumption, that was not released yet.
The Ministry of Health advises, in the Food Guide for the Brazilian Population, that the food in Brazil be based on a wide range of natural or minimally processed food. It is also recommended that processed ingredients and processed food be used in less quantities when preparing the meals. The guide highlights, however, that the consumption of ultra-processed food needs to be avoided, due to the disbalanced nutritional values and the excess of calories.
Although the acquisition of ultra-processed foods have increased continuously in Brazil, the survey analyst, José Mauro de Freitas, notices a deceleration in this trend.
“This is noticed in urban and rural areas and in all regions and income ranges, and might be the consequence of public policies recently implemented, highlighting the actions based on the guide, which recommends the inclusion of natural or minimally processed food in daily meals, avoiding ultra-processed foods”, he says.
Almost half of the acquired calories comes from fresh foods
Between 2017 and 2018, the period of today’s POF survey, about half (49.5%) of total calories available for consumption in Brazilian households came from natural or minimally processed foods; 22.3% were from processed culinary ingredients, 9.8% from processed foods and 18.4% from ultra-processed foods.
Regarding natural and minimally processed foods, rice responded for 15.6% of the total calories, followed by milk, with 5%, meats, with 4.6%, and beans, with 4.3%. Among the processed culinary ingredients more consumed by Brazilians, vegetable oil responded for almost 11% of total the calories, followed by sugar, with almost 10%.
In the group of processed food, the major contribution for total calories were bread (6.7%), cheeses (1.4%), salted/dried/smoked meats (0.7%) and fermented alcoholic drinks (0.7%). Among the ultra-processed foods, the highlights were sausages (2.5%), cookies and sweets (2.1%), salty snacks (1.8%), margarine (1.8%), cakes and sweet pies (1.5%), bread (1.3%), sweets in general (1.3%), sweetened carbonated drinks (1.2%) and chocolate (1%).
The higher the income, the higher ultra-processed acquisition
The survey also shows that households with higher incomes consumed twice as much of ultra-processed food as households with lower incomes. While the availability of this kind of food, which should be avoided, was of 12.5% of total calories in households with lower incomes, in higher-income households it was twice as much, reaching 24.7%.
Besides the highest acquisition of ultra-processed foods, the households with higher incomes consumed more processed food than households with lower incomes (11.1% against 8.4% of total calories). The acquisition of processed culinary ingredients was also higher in households with lower incomes.
Ultra-processed food acquisition is two times bigger in urban areas
In rural areas, the contribution of natural or minimally processed foods to total calories was higher than in the urban area (57.9% and 47.7% respectively), the same happens in terms of processed culinary ingredients (25.3% against 21.7%). On the other hand, the contribution of both processed food and ultra-processed food was higher in urban areas (11.3% and 19.8% against 5.5% and 10.7%).
"The supply of ultra-processed food in the interior is fewer. Those products are in the supermarkets that are concentrated in the urban areas. In the rural areas, the production for own consumption is very common. Producers also exchange products, so the acquisition of fresh food is higher in those areas", explains José Mauro de Freitas Júnior.
South and Southeast acquires more ultra-processed food than other regions
In the country's Major Regions, the contribution of ultra-processed food in the total calories of food supply was higher in the South (22%) and Southeast (21.4%). In both regions, the contribution of these kind of food is higher than in the Central-West (16.6%), Northeast (14.4%) and North (11.4%).
The contrary happens in natural and minimally processed food, whose total calories of food available was higher in the North (58.2%) and Northeast (54.5%); followed by Central-West (50.7%), Southeast (44.9%) and South (47.3%)
The processed culinary ingredients and processed food total calories recorded lower changes, standing, respectively, between 20% - 25% and 8% - 10% in all regions.
Regarding natural and minimally processed foods, cassava flour and fish were the highlights in the North Region. Beans, corn flour and corn meal in the North. Rice was the item with higher contribution to total calories in the Central-West, while in the South, it was wheat flour.
Among the processed culinary ingredients, the highlights were vegetable oil and animal fat in the Central-West and sugar in the Northeast. In the group of processed food, the highlights were bread in the North and Northeast, and cheese in the South and Southeast.
In the group of ultra-processed food, except salty snacks, which are more consumed in the Northeast, and margarine, which is more consumed in the Northeast and Southeast, the other sub-groups follow the pattern noticed for ultra-processed food: more contribution in calories availability in the South and Southeast, followed by the Central-West and less contribution in the North and Northeast.


