2022 Census
2022 Census: Brazil has 8,441 quilombola localities, 24% of them in Maranhão
July 19, 2024 10h00 AM | Last Updated: July 23, 2024 04h23 PM
Highlights
- In 2022 there were 8,441 quilombola localities in the Brazilian territory, associated to 7,666 quilombola localities reported by informants.
- The Northeast region has 5,386 quilombola localities, 63.81% of the total, followed by the Southeast, which has 1,245 localities (14.75%), and the north region, with 1,228 (14.55%).
- Maranhão is the state with the biggest number of quilombola localities, 2,025 (23.99%). Bahia and Minas Gerais come in the second and third positions, with 1,814 localities and 979 localities, corresponding to 21.49% and 11.60% of the total, respectively.
- The municipality with the biggest number was Alcântara (MA), with 122 localities, followed by Itapecuru Mirim (MA), with 121, and Januária (MG), with 101.
- Among the 20 municipalities with the biggest number of quilombola localities, Macapá (AP) is the only capital, with 56.
- Quilombola localities are areas of the territory with permanent agglomerates of quilombola residents and who are not related to a quilombola community and have, at least, 15 self-declared quilombolas whose housing units are, at most, 200 meters far from each other.
- Quilombola communities were declared by each quilombola informant in the 2022 Census. Belonging is related to ethnic, historical and social issues, so one same community can be formed by more than one locality, according to the need of spatial dispersion and the forms of local and regional organizations of each group.
- Location data of quilombola localities, associated to the population data and other indicators and socioeconomic data that have been released by the IBGE, allow the many society segments to have an overview of the population distribution.
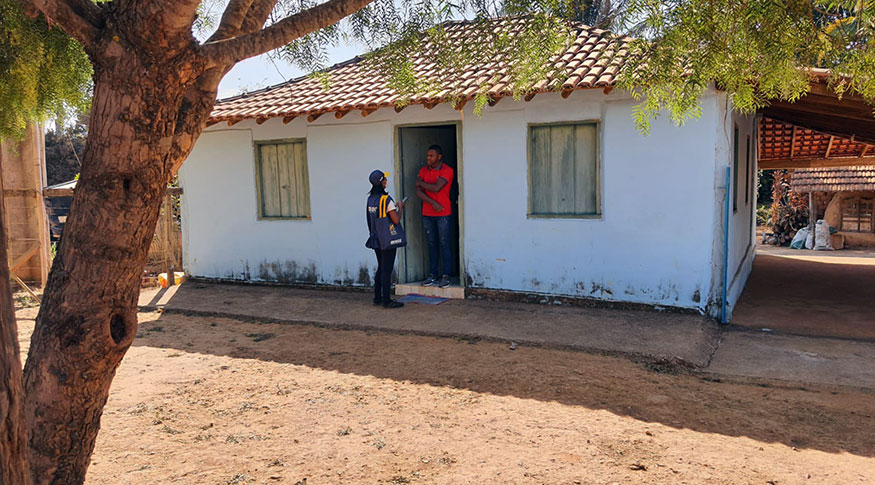
In 2022, there were 8,441 quilombola localities in the Brazilian territory, associated to 7,666 quilombola communities reported by informants of the population Census. The Northeast Region had the biggest number of communities, 5,386 (63.81%) occurrences, whereas Maranhão is the state with the biggest number, 2,025 localities (23.99%).
These results were released today (19) by the IBGE in “2022 Population Census – Quilombolas: Characteristics of housing units and literacy: Population results.” The Institute has also released today “2022 Population Census: Quilombola Localities.” The release event is scheduled for today, at 10 am, at Escola Municipal de Tempo Integral Negro Cosme (a full-time school), located at the Liberdade neighborhood, in São Luís (MA). The event will be streamed live on Digital IBGE.
Read also about literacy of the quilombola population and about characteristics of housing units with at least one quilombola resident.
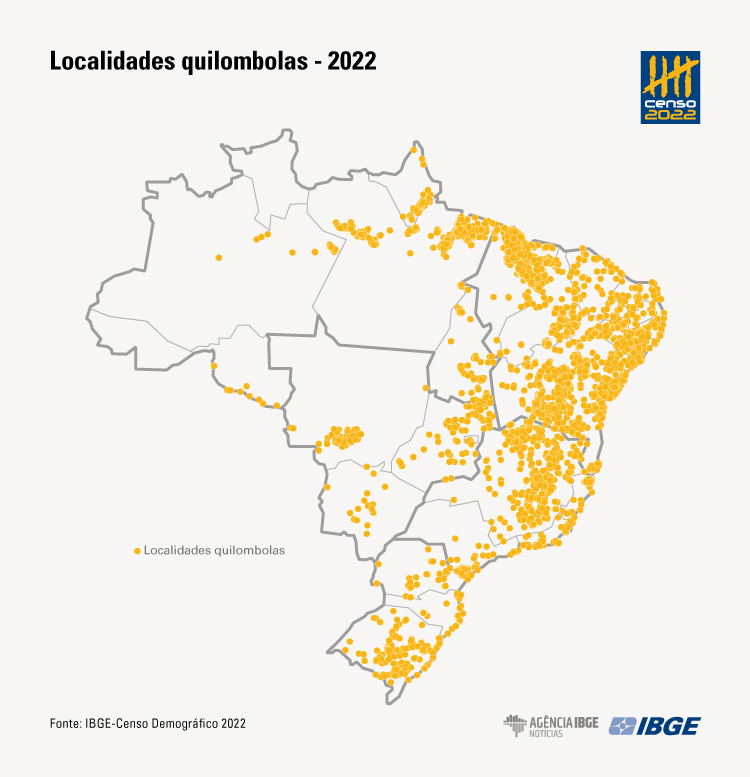
Quilombola localities are defined as areas of the national territory Where there is a permanent cluster with quilombola residents. To be considered localities, these places have to be related to a quilombola community and have a minimum of 15 self-declared quilombolas, living in housing units at a maximum distance of 200 meters from each other.
“Quilombola communities have different spatial configurations. The definition of localities tries to establish standardized criteria for the identification of groups of persons belonging to these communities. The parameters adopted guarantee the confidentiality of ethnic-racial information, and, at the same time, make possible the best identification of the spatial occurrence of quilombolas. A previous consultation to quilombola leaders was included, so that the mapping would reflect the territory diversity of communities,” says Fernando Damasco, IBGE manager for Traditional Territories and Protected Areas.
Quilombola communities were reported by each quilombola informant for the 2022 Census. Belonging is related to ethnic, historical and social issues, so that one same community can be formed by more than one locality, according to the necessity of spatial dispersion and the forms of local and regional organizations of each group. Quilombola localities related to one same community can be found in different territories, in urban or rural areas, in and out of official Quilombola Territories.
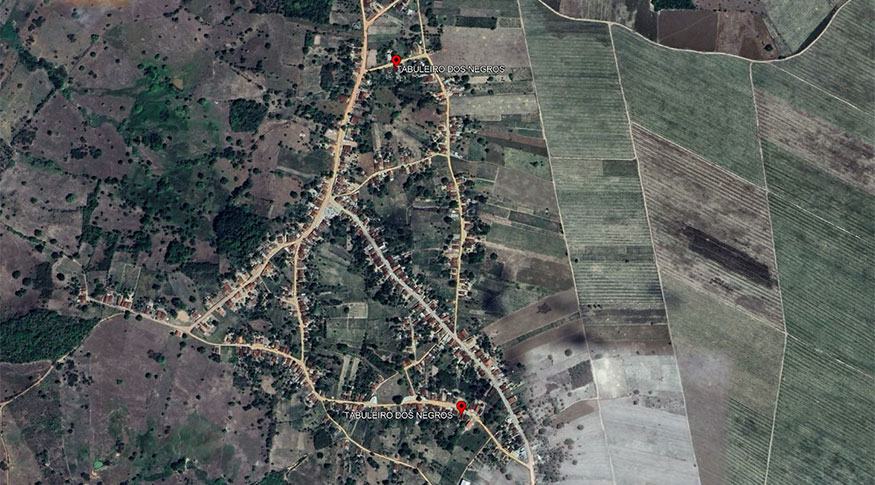
An example can be seen in the image below. The representation shows two different localities related to the quilombola community Tabuleiro dos Negros, in the municipality of Penedo (AL).
The IBGE researcher highlights that the mapping of quilombola localities does not replace the National Registry of Quilombola Communities, produced by the Palmares Cultural Foundation. It is the result of a census survey, which can be used to improve this registry, but certainly cannot replace it, as the national registry follows Other premises and applications within the Federal Government.
“Today the IBGE is able to say how many quilombola localities there are in each municipality in the country and to which communities they are located. This geospatial information, together with population data released by the IBGE, allow the different segments of society to have an unprecedented panorama of the distribution of this population at local level. A new world of possibilities is open so that public policies will reach these communities more easily, besides making possible to detail surveys in the Fields of demography, anthropology and, above all, geography, about the distribution of these groups.”
For application in different geographic information systems, the results of mapping are made available by means of geospatial archives in the SHP (shapefile) and KML (Keyhole Markup Language) formats, besides delimited data format (CSV), together with cartograms that represent the distribution of localities for each of the Federation Units. The data are also available at the IBGE channels Interactive Geographic Platform – and 2022 Census Overview, which allow interactive geospatial visualizations.
Northeast Region has 5,386 quilombola localities, 64% of the total
The Northeast Region, which has the biggest quilombola population among the Major Regions – 906,337 quilombolas (68.14%) – houses the biggest parcel of identified quilombola localities, with 5,386 (63.81%) occurrences related to 4,948 communities reported by the informants.
It is followed by the Southeast Region, with 1,245 localities (14.75%); the North Region, with 1,228 localities (14.55%); South, with 304 localities (3.60%) and Central West, with 278 (3.29%) localities.
Maranhão has 24% of the quilombola localities in the country, with 2,025 occurrences
Among the Federation Units, Maranhão is the state with the biggest number of quilombola localities, with 2,025 occurrences, which is equivalent to 23.99% of the total localities in Brazil. It is followed by Bahia, with 1,814 localities, and Minas Gerais, with 979 localities, corresponding, respectively, to 21.49% and 11.60% of the total.
"We see an important inversion by analyzing data by Federation Units. A year ago, when population figures were released, Bahia had the biggest population and Maranhão the second biggest population. This inversion is probably related to population distribution patterns in these states. Maranhão is a state with a given spatial organization, especially in the rural area, consistently based on small clusters, which ends up increasing the number of quilombola localities,” says the manager.
Of the 20 with most quilombola localities, 11 are in Maranhão
All over the country, 655 quilombola communities (8.54%) have one more locality in the same municipality. The municipality with most localities was Alcântara (MA), with 122 localities, followed by Itapecuru Mirim (MA), with 121, and Januária (MG), with 101.
“With the result of mapping, it is possible to know the location of each locality precisely, which allows one to evaluate how these communities are concentrated or disperse over the municipalities, with the spatial contextualization of this population, says Fernando Damasco.
By analyzing the list of twenty municipalities with most occurrences of quilombolas localities, the IBGE researcher also called attention to the existence of one capital: Macapá (AP) has 56 quilombolas localities.
| Quilombola localities, by decreasing order of the twenty Municipalities with most quilombola localities – 2022 | |
|---|---|
| Municipalities | Quilombola Localities |
| Alcântara/MA | 122 |
| Itapecuru Mirim/MA | 121 |
| Januária/MG | 101 |
| Custódia/PE | 97 |
| Abaetetuba/PA | 87 |
| Cametá/PA | 85 |
| Oriximiná/PA | 82 |
| Penalva/MA | 79 |
| Pinheiro/MA | 74 |
| Santa Rita/MA | 71 |
| Viana/MA | 69 |
| São Vicente Ferrer/MA | 63 |
| Cururupu/MA | 62 |
| Macapá/AP | 56 |
| São Bento/MA | 55 |
| Serrano do Maranhão/MA | 55 |
| Bom Conselho/PE | 55 |
| Baião/PA | 54 |
| Óbidos/PA | 54 |
| Anajatuba/MA | 52 |
| Fonte: IBGE, Censo Demográfico 2022. | |
More about the survey
The Population Census is the most complete statistical operation in the country, covering all the 5,570 Brazilian municipalities. The first results of the 2022 Population Census for quilombolas were released in July 2023 and are available on the IBGE News Agency. A second round of results was released in December the same year, and counted 1,330,186 quilombolas in 25 Federation Units. In May 2024, demography for the quilombola population in Brazil was inaugurated, with releases of analyses by sex and age.
The publication “2002 Population Census: characteristics of housing units and literacy, by specific territories – population results” presents information such as sanitation conditions of housing units with at least one quilombola residents, in and out of official Quilombola for Brazil, Federation Units, Municipalities, Legal Amazon by Federation Units, official Quilombola Territories and Quilombola territories by Federation Units.
The data are also available at the Interactive Geographic Platform (PGI), the 2022 Census Overview and Sidra.


