System of Cultural Information and Indicators
North Region has the lowest access to cinemas, movie theaters and museums


December 01, 2023 10h00 AM | Last Updated: December 05, 2023 02h17 AM
Highlights
- Approximately 31.4% of the population in Brazil lived in municipalities without any museums and this proportion was higher among children and teenagers up to 14 years of age (34.3%).
- In 2021, in 14.9% of the municipalities, residents had to travel for at least one hour to reach the nearest municipality where there is a with a museum. In the North, the proportion was 70% of the municipalities and in the South, 1.3%.
- In the same year, cinemas were available in only 9% of the municipalities in the country, being more concentrated in the Southeast Region. There was a higher proportion of municipalities in Brazil where residents had to travel for more than one hour to reach that type of facility (80.4%) than to get to a museum (70.0%) or theater (65.1%).
- In the northern states, the average duration of travel to reach cultural facilities in the closest municipality was almost above one hour. On the Other hand, in the average duration was 16 minutes.
- Between 2017 and 2018, 58.5% of the families in the country did not have a personal computer or laptop at home, 30.7% had at least one of these appliances and 10.8% had two or more of them.
- In 2022, the cell phone was the most often used appliance for Internet access: 159.9 million used this type of access, that is, 98.9% of the total accesses.
- Between 2012 and 2022, public expenditure with the cultural sector increased by 73.1%, with a change from R$7.9 billion to R$13.6 billion, an increase below inflation, which was 80% in the period. In the federal sphere, expenditure fell by 33.3%, whereas in states and municipalities, there were increases of 77.7% and 125.1%, respectively.
In 2021, in 14.9% of the municipalities in the country, residents would have to commute for at least one hour to reach the nearest museum. The data portray a regional inequality: whereas in the Northeast, residents of 70% of the municipalities would have to spend at least one hour to get to that cultural facility, in the South, that proportion was 1.3%.
These data are part of the System of Social Information and Indicators (SIIC), which, besides the access to culture, presents analyses aboutenterprises, employment and relevance of the sector for the economy. The publication was released today (Dec 01) by the IBGE.
In order to explain the potential access to cultural facilities and means of communication, researchers combined data of MUNIC 2021 and Continuous PNAD. So, it was possible to observe what percentage of the population was living in municipalities with and without access to museums, movie theaters or concert halls and local AM or FM radio stations. In 2021, 76.1% of the population lived in municipalities with a local AM or FM radio station, the highest potential access among all facilities, followed by 69.4% of the population in municipalities with a theatre or concert hall and 68.6% with a museum. Cinemas were concentrated in municipalities inhabited by 57.4% of the population.
Inequality of access to facilities was observed considering the population by sex, color or race, age group and level of schooling. About 31.4% of the population in the country lived in municipalities without a museum, but the proportion was higher among men (32.1%) than women (30.7%). There was also a higher concentration of the black and brown population (36.6%) than of white ones (24.8%) in this condition.
Deprivation of access to this facility was mostly observed among children and teenagers up to 14 years of age (34.3%) and among those without schooling or with incomplete basic education (38.7%). “As for children, the lower access is alarming, because being in contact with museums during childhood helps them develop more interest during other phases of life,” says Leonardo Athias, analyst of the survey.
By using data from MUNIC 2021 and a model to calculate routes, distances and duration of travel applied to the reference base for road, water and air distance, it was possible to estimate how long it takes someone living in a municipality without a museum, cinema or theater to reach the nearest municipality with that type of facility.
In the North Region, there was a higher proportion of municipalities where residents used to spend more than one hour to get to one of the listed facilities. Besides a more difficult access to museums, in 80.4% of the municipalities, residents had to travel for at least one hour to reach a cinema. The South Region, on the other hand, had the lowest proportion of municipalities in this situation: 14.9%. In the case of a theater or concert hall, 65.1% of the municipalities in that Major Region were more than one hour away from the closest municipality where the desired facility was available. In the South, only 4.0% were in the same condition.
Besides being the best available type of facility (found in 29.6% and 23.3% of the municipalities, respectively), museums and theaters were better distributed all over the national territory. Theaters, found in only 9% of the municipalities in Brazil, were more concentrated in the Southeast Region. “The cinema was the most selective one in terms of territory,” Mr. Athias explains.

Another aspect observed by the study was the average duration of the travel from each Federation Unit to reach the cultural facilities located in the nearest municipality. As for the cinema, in northern states, the averages were always above one hour far from the facility. Amazonas had the highest value (23 hours and 26 minutes). In the Northeast, the biggest distances were traveled by the population of Maranhão (1 hour and 58 minutes) and Piauí (1 hour and 49 minutes). On the contrary, in Rio de Janeiro, a person living in a city without a cinema would have to travel, on the average, only 16 minutes to reach that facility.
“Data about the average travel time show even the inequalities within the states. In the west of Bahia or in the north of Minas Gerais, for example, a longer time was necessary to reach the three types of facility studied. In Amazonas, about 13 hours and 48 minutes to get to the nearest municipality, whereas, in the other states of the North travel time was lower. In the Federal District, trave time would be zero.”
Between 2017 and 2018, 70.7% of the housing units had at least one led, plasma or LCD TV sets
In this edition of SIIC, considering data from the Consumer Expenditure Survey (POF) 2017-2018, investigated the presence of durable goods in the housing units, which allows of the potential access to goods related to cultural enjoyment. In most homes (70.7%), there was at least one led, plasma or LCD television (41.5%), presence of a tablet in housing units was much lower (13.3%).
The ownership of goods was unevenly observed in terms of level of schooling. More than half (51.3%) of the families in which the reference person had a higher education degree had one or more thin-screen TVs at home. When the reference person had no schooling, the proportion drops to 5.6%. Almost one third (31.3%) of the families with a white reference person had more than two TV sets, whereas for black persons this percentage was 16.0%.
Whereas 58.5% of the families in the country did not have a personal computer or laptop, 10.8% had two or more. In those where the reference person had no schooling, only 1.1% of them had two or more personal computers or laptops, against 36.6% of those with a higher education. Inequality is also observed in regional terms: only 6.0% of the families in the North and 6.5% in the Northeast had more than one of these pieces of equipment at home. “The access of children and teenagers to personal computers, which is linked to Internet access, may be jeopardized by the absence of this good, which was mostly used individually than in the audio-visual segment.”
88.3% of the Internet users watched videos in 2022
Using data from the module Information and Communication Technology (ICT) of Continuous PNAD, SIIC analyzed the access to technological goods, which is also related to the potential consumption of cultural content. Last year, the majority of the population aged 10 and over (86.5%) had a cell phone for personal use. This proportion advanced by 9.1 percentage points (p.p.) from the beginning of the time series, in 2016 (77.4%).
The percentage of women who had a cell phone (88.0%) was higher than that of men (85.0%). Among White persons the percentages were also higher (89.4%) in comparison with those of black or brown ones (84.3%). In 2022, about 98.8% of the persons with a higher education degree had a cell phone.
Between 2016 and 2022, the percentage of persons who accessed the Internet at least once in the three months preceding the interview increased from 66.1% to 87.2%. the cell phone was the most often used means for this purpose: 159.9 million accessed the Internet using the telephone in 2022, which represented 98.9% of all the persons accessing the Internet. Almost Half of the persons (47.7%) who accessed the Internet using the television set of another type of equipment, a significant increase from 2016 (11.7%). That suggests, for example, the use for streaming and videogames.
Last year, the use of the Internet was most common among white persons (88.9%) than among black and brown ones. The proportions among persons aged 15 to 29 (95.6%) and 30 to 59 (91.9%) were also higher than among other age groups. In the analysis by level of schooling, the highest percentages were found among persons with complete higher education or incomplete higher education (96.3%) and higher education (98.2%).
The purpose of Internet use was also investigated. Speaking via voice or video calls was the most recurrent one, reported by 94.4% of the users. This percentage increased from 2016 (73.4%). The second most common option among users was sending text or voice messages, or images by means of varied e-mail applications (92.0%), which has dropped by 2.2 p.p. since the beginning of the series. Watching videos, including shows, series and films (88.3%) was also mentioned, with an increase of 11.7 p.p. between 2016 and 2022.
On the other hand, the percentage of persons who used the Internet to send or receive e-mails decreased from 69.2% to 59.4% in the period. That might indicate the preference for more recent forms of communication, characterized by interactivity, such as message applications and social media.
Increase of cultural price index is below that of total IPCA between 2020 and 2022
Cultural Price Index (IPCult) monitors values of a basket of goods and services. The indicator starts in 2020, with 30 cultural subitems subdivided into six groups.
The evolution of proportional weights in July of every year between 2020 and 2022 was also analyzed. In this period, Telephony, subscription TV and Internet (about 60%) accounted for the main contribution, followed by Personal expenditure with cultural products and services, Household articles and Teaching products and activities. The subgroups with the lowest share in IPCult are Personal accessories and Newspapers, magazines and subscriptions.
Between 2020 and 2022, IPCult was below the IPCA, in cumulative changes in 12 months. In the three Years, on average, there was a cumulative change of 3.2% in IPCult against 6.8% in IPCA. According to the study, the biggest difference between the two indexes was marked between 2021 and 2022, which is explained by repercussions of the economic crisis caused by Covid-19.
The subgroup personal accessories (10.0%) recorded the biggest average change of prices between 2020 and 2022, followed by Newspapers, magazines and subscriptions (9.4%). The smallest changes came from teaching products and activities (3.8%) and Telephony, subscription TV and Internet (1.1%).
In 2021, 35.8% of the trips for personal reasons aimed at leisure purposes
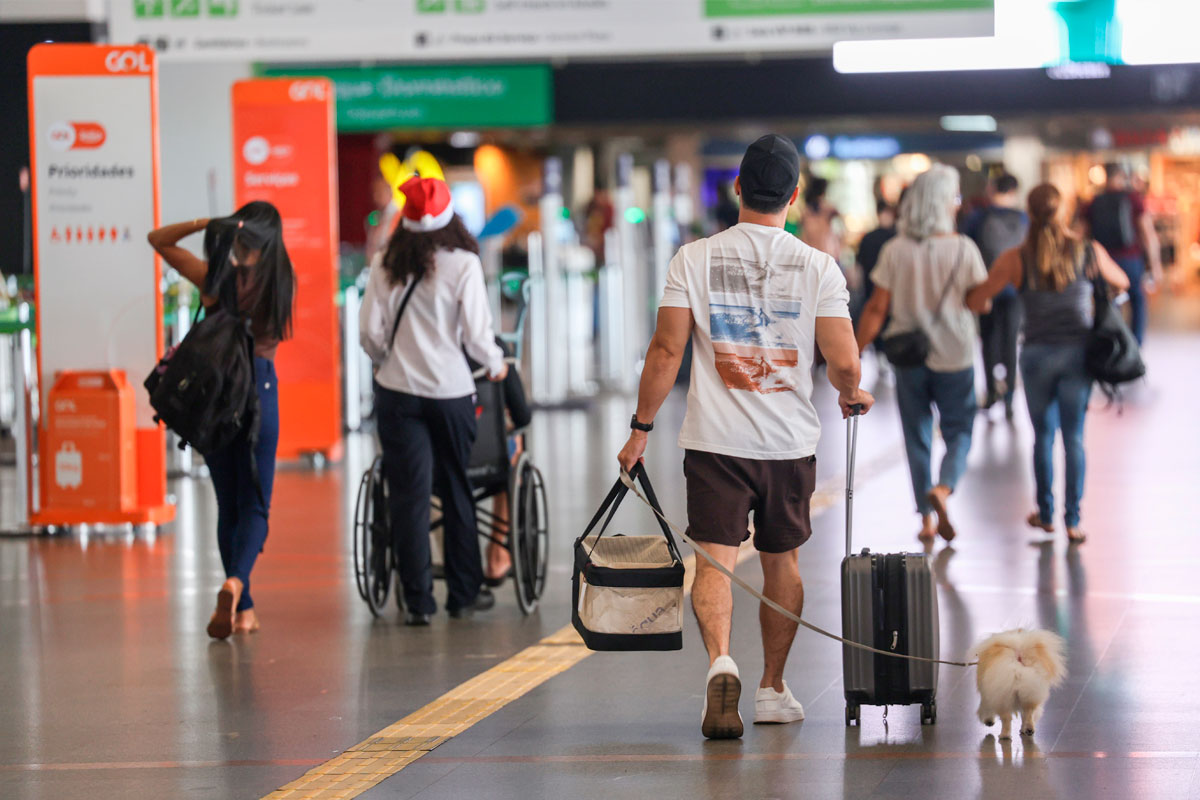
Based on information from the tourism module of Continuous PNAD, the study presents data on the trips taken by the Brazilian population. At the time, each housing unit selected could report a maximum of five trips and three of them were thoroughly analyzed. In 2021, in about 12.7% of the housing units, at least one of the residents had taken at least one trip. That is equivalent to 12.4 million trips and most of them (85.4%) were for personal purposes, whereas 14.6% were for personal purposes.
Within the population overall, leisure represented 35.8% of the purposes of trips for personal reasons. Among the housing units with the highest earnings per capita, that was the main purpose of this kind of trip, whereas among those with lower earnings, the most reported purposes were “heath treatment and welfare” and “visits to relatives and friends.” The survey also estimated at 602 thousand the number of trips for culture and gastronomic purposes and 963 thousand for nature, ecotourism, or adventure. Together, both types accounted for 41.6% of the leisure trips in 2021.
Trips motivated by culture and gastronomic purposes and nature, ecotourism or adventure purposes were less common in housing units with the lowest earnings (below ½ a minimum wage per capita). In these cases, trips for sun and beach purposes prevailed (59.0%). In these housing units, 11.1% of the leisure trips were for culture and gastronomic purposes and 17.0%, for nature, ecotourism, and adventure purposes. In housing units with earnings of 4 minimum wages and over, the most often reported motivation was also sun and beach (44.2%), but two leisure options had higher percentages than in other ranges: culture and gastronomy (19.1%) and nature, ecotourism or adventure (29.6%).
Public expenditure with culture increased by 73.1% in one decade
The study also approached government expenditure with culture, by the three spheres, between 2012 and 2022. In this period, public expenditure with the cultural sector increased about 73.1%, having changed from R$7.9 billion to R$13.6 billion. In the federal sphere, there was a reduction of costs by 33.3%, whereas in the case of states and municipalities, the increases amounted to 77.7% and 125.1%, respectively. As a reference, IPCA increased by 80% in this period.
According to researchers, recent expansions result from resources of Laws Paulo Gustavo and Aldir Blanc. Last year highest expenditure with culture in the time series. Whereas expenditure by the Federal government remained stable (R$1.2 billion), state and municipal spheres increased by R$3.5 billion and R$4.3 billion.
In spite of that, the share of culture in total expenditure dropped in the three spheres of government. In the federal sphere, there was a drop of 0.07 p.p. against the start of the series, in 2012, with a change from 0.10% to 0.03%. Among state governments, decrease also amounted to 0.07 p.p. (from 0.41% to 0.34%). As for municipal governments, expenditure with culture, which represented 1.05% of the total in 2012, fell to 0.81% in 2022, a drop of 0.24 p.p.
The total exemptions for the cultural sector amounted to R$ 3.9 billion in 2022, which is equivalent to an increase of 140% from the total in 2012 (R$ 1.6 billion). The main modes in 2022 were the National Program of Support to Culture – Pronac (R$ 1.9 billion) and exemptions related to imports and sales of books (R$ 1.6 billion).
About the study
SIIC (2011-2022) presents information on employment and number of companies engaged in cultural activities, as well as on value added generated by such activities. Also relevant are the cultural Price Indexes (IPCult) and the access of families to cultural products and services. In this edition, there are data on leisure tourism and on municipal facilities and policies in culture, with information detailed by Major Regions and, for some indicators, by Federation Units and Municipalities.