Consumer Expenditure Survey
Three new indexes show drop of poverty and vulnerability between 2008-2009 and 2017-2018


August 25, 2023 10h00 AM | Last Updated: August 28, 2023 11h16 AM
Highlights
- The Evolution of Non-Monetary Indicators of Poverty and Quality of Life in Brazil, based on the Consumer Expenditure Survey (POF), is part of the IBGE´s experimental statistics and portrays the evolution of poverty and vulnerability in Brazil from a multidimensional and non-monetary approach.
- This work introduces three indexes: Non-Monetary Multidimensional Poverty Index (IPM-NM), Non-Monetary Multidimensional Vulnerability Index (IVM-NM) and Non-Monetary Multidimensional Poverty Index with Relative Component (IPM-CR).
- These indexes take into account non-monetary indicators for six dimensions: housing, access to public utility services, health and food, education, access to financial services and standard of living, and transportation and leisure.
- Between 2008-2009 and 2017-2018, the IPM-NM retreated 65%, the IVM-NM reduced 47% and the IPM-CR dropped 20%.
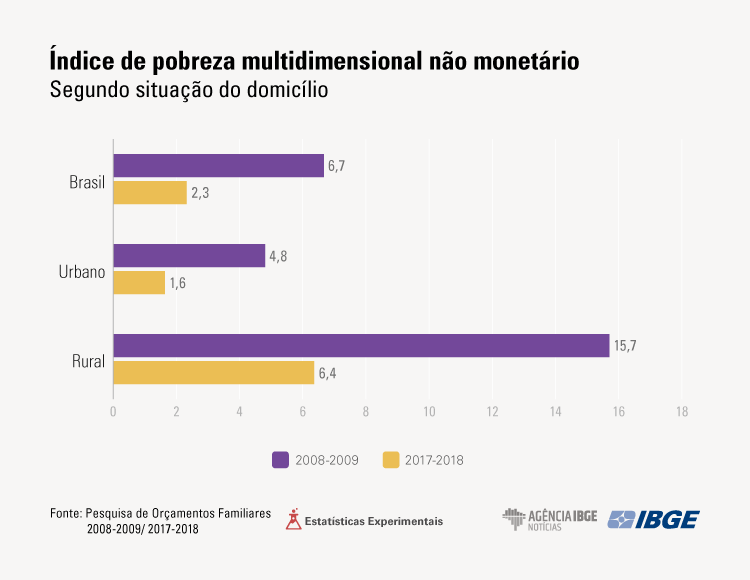
- The IPM-NM dropped from 6.7 in 2008-2009 to 2.3 in 2017-2018. The IPM-NM also retreated in the urban (from 4.8 to 1.6) and rural (from 15.7 to 6.4) divisions.
- The IPM-NM reduced in all the Federation Units between the two POF editions. Santa Catarina (0.3) registered the lowest index and Maranhão, the highest one (7.7).
- In the 2008-2009 period, nearly 44.2% of the Brazilian population had some degree of non-monetary multidimensional poverty. That proportion retreated a lot in the next edition of POF: in 2017-2018, nearly 22.3% of the population had some degree of poverty.
For the first time ever, the IBGE releases, as experimental statistics, the Evolution of Non-Monetary Indicators of Poverty and Quality of Life in Brazil, based on the Consumer Expenditure Survey (POF). Based on the two last editions of POF (2008-2009 and 2017-2018), this work follows up the evolution of poverty and vulnerability in Brazil from a multidimensional and non-monetary approach.
The study introduces three indexes: Non-Monetary Multidimensional Poverty Index (IPM-NM), Non-Monetary Multidimensional Vulnerability Index (IVM-NM) and Non-Monetary Multidimensional Poverty Index with Relative Component (IPM-CR).
“POF investigates different aspects of life of families: the monetary aspect, acquisition of goods and services and quality of life,” explains Leonardo Oliveira, manager of the survey. “The availability of POF data allows a complementary view on traditional indicators of poverty based only on income and consumption. The richness of POF information allows to follow up non-monetary indexes on quality of life and poverty, which might follow paths different from traditional indicators, as they take into account aspects of health, education, environment, etc.” explains him.
The study pinpointed the universe of persons with some degree of either poverty or vulnerability, under a multidimensional point of view, assessing nearly 50 non-monetary indicators, divided into six dimensions: housing, access to public utility services, health and food, education, access to financial services and standard of living and transportation and leisure.
Persons are considered in poverty situation whenever the survey detects losses and deprivations of quality of life equivalent to at least two full dimensions. Therefore, we know that 22.3% of the Brazilian population had some degree of multidimensional poverty in 2017-2018, and that it lost 21.9 percentage points (pp) in relation to the percentage (44.2%) found by POF 2008-2009.
On the other hand, a vulnerability situation exists whenever losses equivalent to, at least, the size of a full dimension are detected, i.e., half the requirement to classify a multidimensional poverty situation. In 2017-2018, nearly 63.8% of persons lived with some degree of multidimensional vulnerability, a lower proportion than that found in 2008-2009 (81.7%).
IPM-NM reduces 65%, though inequality among groups of color or race increases
Different degrees of poverty noticed were incorporated into the calculation of the IPM-NM, which fell from 6.7 in 2008-2009 to 2.3 in 2017-2018, a change of 65%. For the analyst, that retreat reveals a more intense drop in the poverty indeed. The study also showed drops in the urban (from 4.8 to 1.6) and rural (from 15.7 to 6.4) divisions. “Poverty remained higher in the rural area, pointing out that the inequality in quality of life remains between these two areas,” states Oliveira.
The IPM-NM reduced in all the regions, highlighted by the South Region, which recorded the lowest index in 2008-2009 (2.2) and reported the biggest percentage reduction in 2017-2018 (it dropped to 0.6). In contrast, the North and Northeast regions remained with the highest IPM-NMs, the former changing from 13.8 to 5.2 and the latter, from 12.4 to 4.3. In the two POF editions, the Northeast contributed with more than half of the losses of quality of life in Brazil.
The IPM-NM reduced both for families whose household head was a white person and for those whose household head was either a black or brown person. However, the reduction in the share in the value of the index occurred only for families whose household head was a white person: it changed from 22.9% to 19.7% in the period under analysis. In other words, the share of families whose household head was either a black or brown person in the index of multidimensional poverty in Brazil increased from 75.7% in 2008-2009 to 79.1% in 2017-2018. “It should be highlighted that these data also reflects a higher number of persons self declaring as either black or brown,” states the analyst.
The results also show a signifcant drop of the index in all the sub-groups of levels of schooling of the household heads of families. The shares in the value of the index for the parcel of the population that lived in families whose household heads had no education reduced (23% to 21.2%), as well as of the population whose family had a household head with incomplete primary education (60.7% to 55.7%). “In other words, the concentration of poverty remains still high in these two levels of schooling, which account for more than 75% of the index,” states Oliveira.
The IPM-NM remains higher in families with children (7.9 with more than one adult and 7.1 for one adult). Nevertheless, the percent contribution to the value of the index by the sub-group of families with more than one adult and at least one child decreased, changing from 63.3% to 55.3%. On the other hand, the share of families with more than one adult and no children grew from 16% in 2008-2009 to 21.2% in 2017-2018.
Taking into account the tenths of per capita household disposable income, every sub-group dropped. “Yet, the indexes in the lowest tenths remain quite above the value seen for the last tenth,” explains the analyst. As a result, the group with four brackets of lower earnings increased the share in the overall index, reaching 79.4%.

In the analysis by sub-group defined by sex of the household head of the family, the IPM-NM did not show any significant difference for the distance between the indexes in 2008-2009. However, the drop of the index was bigger in the cases in which the household head was a man (going from 6.6 to 2.1) than in the cases in which the household head was a woman (going from 6.8 to 2.7).
Between 2008-2009 and 2017-2018, the indexes of the Federation Units improved, though in an unequal way. In that period, no state in the North or Northeast registered an IPM-NM below the national average. The lowest index was in Santa Catarina (which went from 2.0 to 0.3) and the highest one was in Maranhão (which went from 18.7 to 7.7). Ceará recorded the lowest index in the Northeast (3.0) and Rio de Janeiro reported the highest one in the Southeast (2.1) in 2017-2018.
IVM-NM dropped 47% between 2008-2009 and 2017-2018
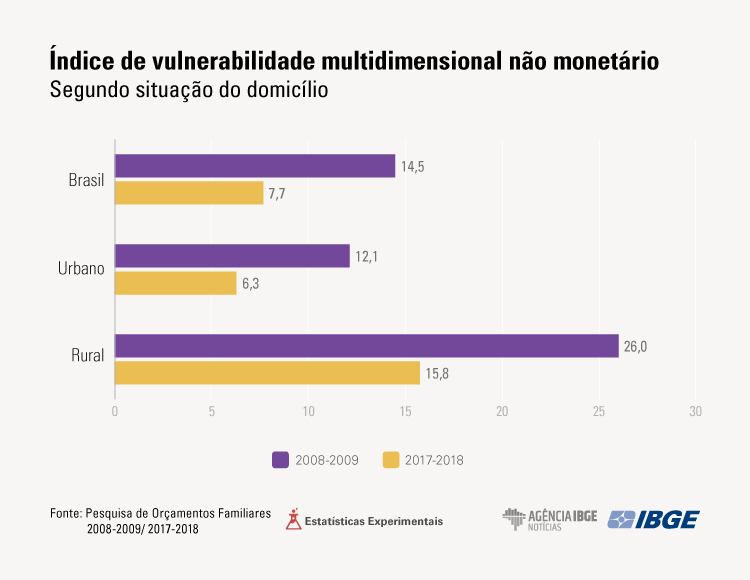
The Non-Monetary Multidimensional Vulnerability Index (IVM-NM) in Brazil fell from 14.5 in 2008-2009 to 7.7 in 2017-2018, a retreat of 47%. Therefore, the decrease of this index was smaller than that observed in the IPM-NM. However, the behavior was the same observed in the previous index: the contribution of the urban area (69.8%) was more than twice that of the rural area (30.2%).
Among the regions, the North and Northeast registered the highest values, the former going from 24.0 to 13.7 (drop of 43%) and the latter going from 22.3 to 12.2 (-45.5%). On the other hand, the South had an IVM-NM of 8.2 and reduced it to 3.9, dropping 53.1% in the period.
IPM-CR dropped 20% in the period between the surveys
Unlike the other two indexes, the Non-Monetary Multidimensional Poverty Index with Relative Component (IPM-CR) does not adopt cutoff points nor it classifies people as either poor or non-poor. “This index uses a belonging function, based on the information on individual losses of quality of life,” explains the analyst. The belonging function associates a relative component or degree to each person in the population. Together, the relative component and the level of losses of quality of life of each person determine the degrees of poverty in the population, as well as the value of the index.
The Brazilian IPM-CR retreated 20% in the period under analysis: from 15.0 in 2008-2009 to 12.0 in 2017-2018. The index retreated both in the urban and rural areas, with similar reductions, around 19%, following the highest intensity of poverty in the rural area in relation to the urban one.
The IPM-CR did not stay below the Brazilian average in any state in the North or Northeast. According to the index, poverty reduced in all the Federation Units. In Maranhão, the IPM-CR fell from 27.6 in 2008-2009 to 22.0 (reduction of 20.3%). In Santa Catarina, the index retreated from 9.3 to 6.7, a drop of 28%.
Proportion of persons with some degree of poverty retreats from 44.2% to 22.3%
In POF 2008-2009, nearly 44.2% of the population had some degree of non-monetary multidimensional poverty and 81.7% had some degree of vulnerability. These proportions reduced a lot in POF 2017-2018, when nearly 22.3% of the population had some degree of poverty and 63.8%, some degree of vulnerability.
In absolute numbers, the contingent of persons with some degree of non-monetary multidimensional poverty retreated from 84.1 million to 46.2 million in the period under analysis.
The weight of the dimensions is balanced along the three indexes, with a drop in the contribution of Transportation
The results also show the impacts of each dimension on the three indexes. In the IPM-NM of 2017-2018, the dimensions Access to financial services and standard of living (19.2%), Education (17.6%) and Health and food (17.0%) registered the biggest contributions to the total marginal effects on the index. Transportation and leisure, which led the previous edition, changed from 21.3% to 15.7%, whereas Housing jumped from 9.9% to 14.7%. Lastly, Public utility services maintained the same level: from 15.5% to 15.8%.
In the IVM-NM, Access to financial services and standard of living increased from 19% to 19.5%, the biggest contribution. It was followed by Education, changing from 18.8% to 18.6%. The contribution of Transportation and leisure, which led the previous edition, dropped from 23.8% to 16.8%. It was followed by Health and food (from 15.3% to 15.1%), Housing (from 9.2% to 15%) and Public utility services (from 13.9% to 14.9%).
In the IPM-CR of 2017-2018, the three dimensions with the biggest contributions were Access to financial services and standard of living (19.3%), Education (19.1%) and Transportation and leisure (17.3%).
More about the survey
The Consumer Expenditure Survey (POF) provides information on the household budget composition, living conditions and the nutrition profile of the population. Continuing the series of studies to assess quality of life in Brazil, this publication makes a time analysis of this theme, based on the calculation of three multidimensional indexes, taking into account a wide set of non-monetary indicators distributed along six dimensions of interest.