Domestic industry
After three months of decrease, output of industry increases by 1.4% in May


July 02, 2021 09h00 AM | Last Updated: July 06, 2021 05h54 PM
The output of industry increased from 1.4% from April to May, after three consecutive months of increase. In this period, there was a cumulative decrease of 4.7%. With the May result, industry reached the same level as in February 2020, in the pre-pandemic level. Despite the increase, the sector is still 16.7% below the record level of May 2011.
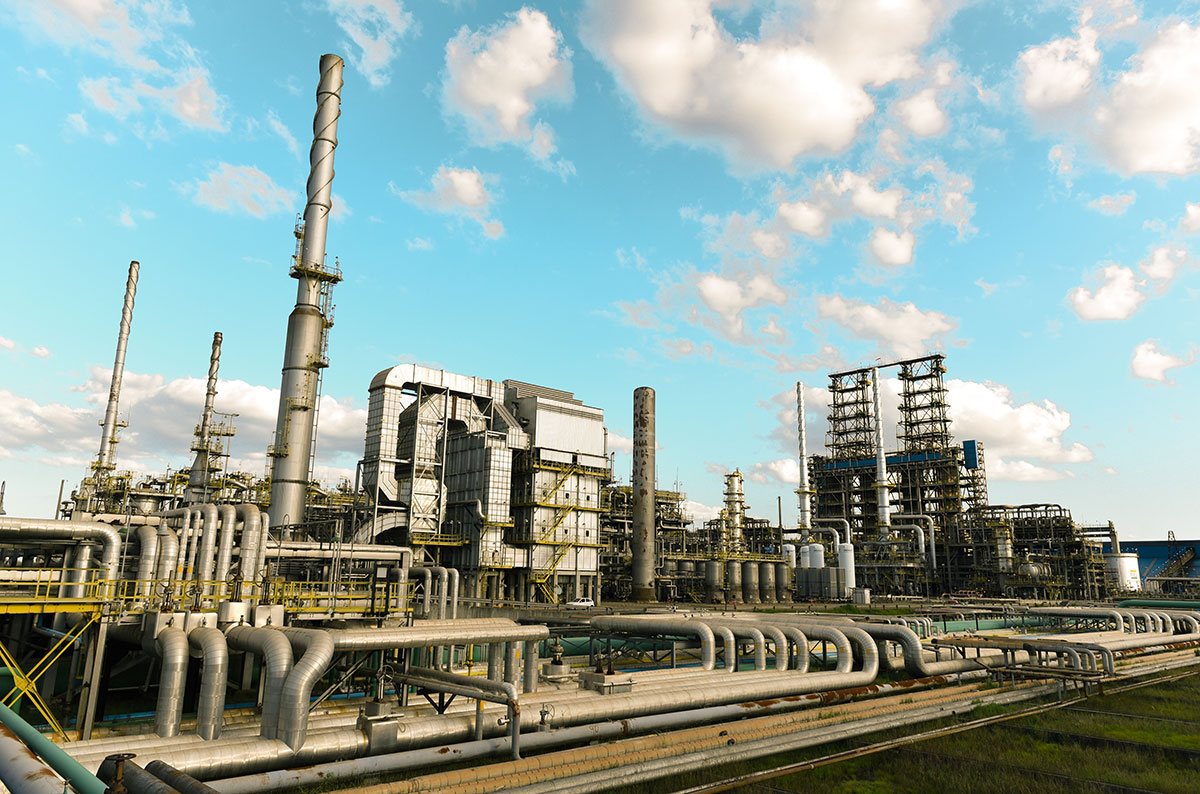
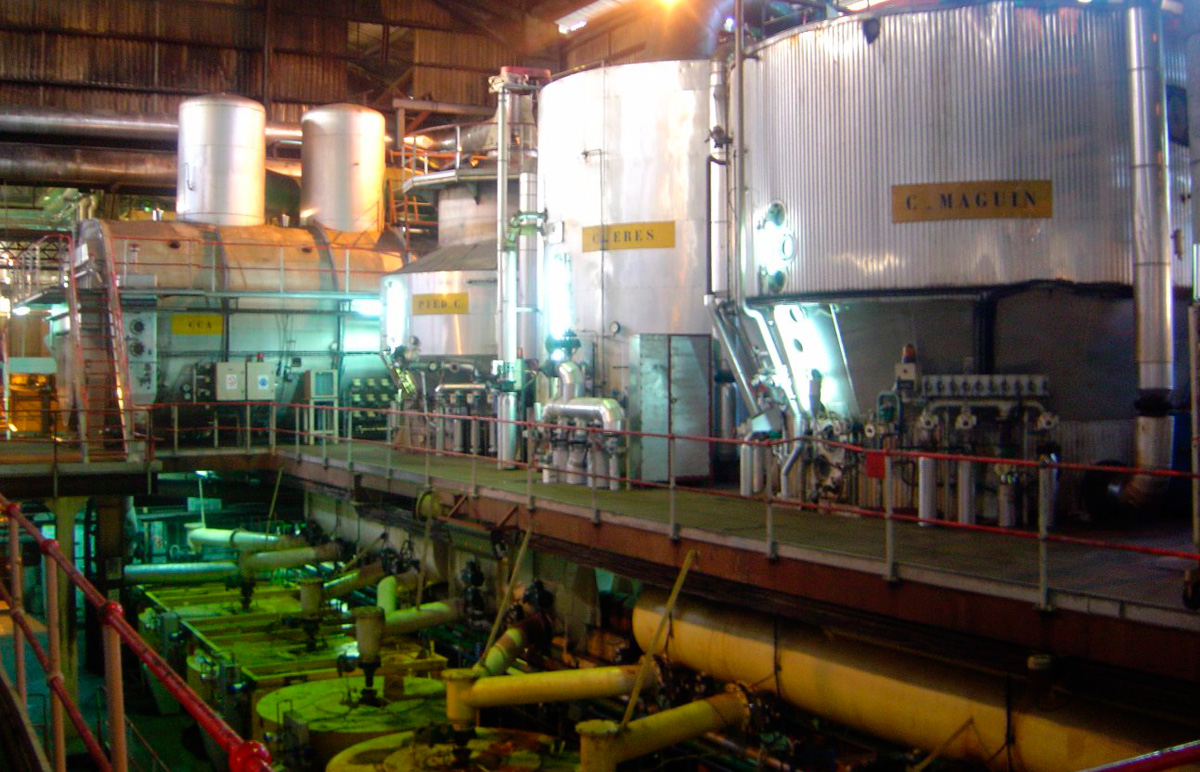
Food products (2.9%), coke, petroleum products and biofuels (3.0%) and mining and quarrying industry (2.0%) led the monthly increase. Data comes from the Monthly Survey of Industry (PIM), released today (2) by the IBGE. The sector had a cumulative increase of 13.1% in the year and of 4.9% in the last 12 months.
The survey manager, André Macedo, mentions that the positive result of May does not mean a reversal of the cumulative negative result in the months of February, March and April. “There is a return to the positive results, but still far from recovering the recent loss of industry. A lot of this behavior of negative predominance in the last few months is directly related to the resumption of the pandemic, in the beginning of 2021, which caused disconnection of productive chains.”
The researcher highlights that the lack of raw material and the higher production costs are among the consequences to the production costs followed by the industrial sector. “Although the result of May in comparison with April was positive, when we observe the beginning of 2021, in terms of the resumption of the pandemic and all its effects, the balance is still, considering that when analyzing other indicators, such as the quarterly moving average index, figures are still going downward,” he says. In May, the quarterly moving average index fell 0.8%.
The positive result of the general index in May was observed in 15 of the 26 activities surveyed by the survey. “This bigger number of activities recording increase is related to the fact that, in previous months, there was a widespread profile of decrease in activities. That leads to a natural return to increase due to steeper decreases in those months,” Mr. Macedo says.
The main positive impacts among the activities came from food products (2.9%), coke, petroleum products and biofuels (3.0%) and mining and quarrying industry (2.0%). The First two ones increased after having decreased in April. “Most of the activities increased again after important losses in previous months. The sector of petroleum products, for example, which accounted for the second main positive impact this month, had had a decline of 10%. That means there is some level of recovery in relation to losses in the last few months.”
Other positive results came from the activities basic metals (3.2%), Other chemicals (2.9%), pharmaceuticals (8.0%), beverages (2.9%) and manufacture of wearing apparel and accessories (6.2%). The activities that had the biggest negative impacts on the index were rubber products and plastic material (-3.8%), machinery and equipment (-1.8%) and textiles (-6.1%).
There were advances in two major economic categories: semi-durable and non-durable consumer goods (3.6%) and capital goods (1.3%). Producers of durable consumer goods (-2.4%) and intermediate goods (-0.6%) recorded decreases in May.
Industry records and increase of 24.0% against May 2020
Against May last year, the output of industry increased by 24.0%, second highest rate a since the start of the time series, in January 2002. The biggest increase was recorded last month (34.7%). That is the ninth consecutive month of increase in this indicator.
The manager of the survey highlights that the positive results are a consequence of the low comparison basis, since, at that time, industry was facing the consequences of interruption of activities in industrial plants due to distancing measures to fight the Covid-19 pandemic. “We should keep in mind that the months of April and May last year were lowest in the time series. That explains these very significant rates from the perspective of the magnitude and this spread of positive results among the activities,” says André. In May 2020, the industrial sector had fallen by 21.9%.
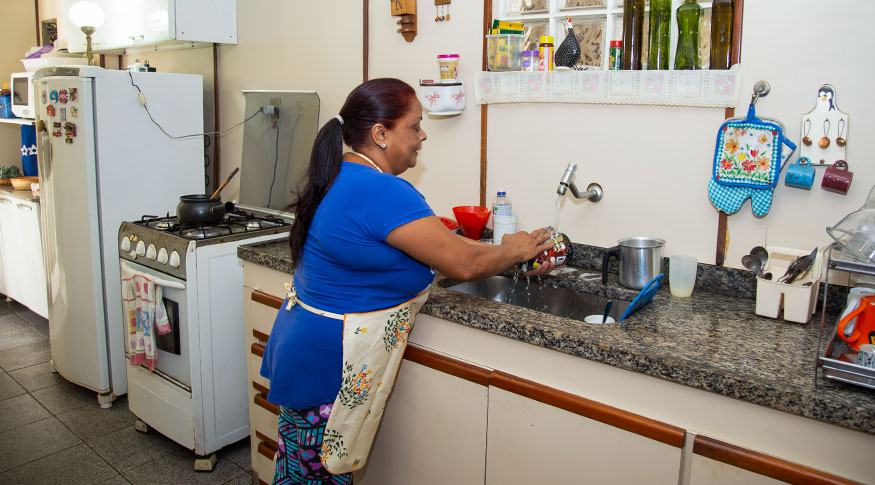
André Macedo reinforces that, besides having a negative impact on the industrial index, the aggravation of the pandemic reached other economic sectors, whcih has an effect on the results of industry. “From the perspective of household consumption, from demand, there are factors that affect our everyday lives: lowerdisposable income, higher inflation, an important number of workers out of the labor market. All of that has an effect and industrial production is affected somehow.”
The positive results of this indicator, in May 2021, reached all the major economic categories, 22 of the 26 activities, 69 of the 79 groups and 76.3% of the 805 products surveyed. Among the main activities are: motor vehicles, trailers and trunks (216.0%), machinery and equipment (64.9%), basic metals (49.3%), mining and quarrying industry (11.8%) and non-metallic mineral products (47.1%).
More on the survey
A PIM Brasil PIM Brazil has been producing short-term indicators since the 1970s regarding the behavior of the real product of the mining and quarrying and manufacturing industries. From May 2014, the release of a new series of monthly industrial production indices began, after a reformulation to: update the sample of activities, products and respondents; prepare a new weighting structure for the indices based on the most recent industrial statistics, in order to harmonize with the needs of the implementation the National Accounts Series - reference 2010; and to adopt the new classification of activities and products used by other industry surveys from 2007 onwards, namely: the National Classification of Economic Activities - CNAE 2.0 and the List of Industrial Products - PRODLIST-Industry.
The survey results are available at the Sidradatabase.