Contas Econômicas Ambientais
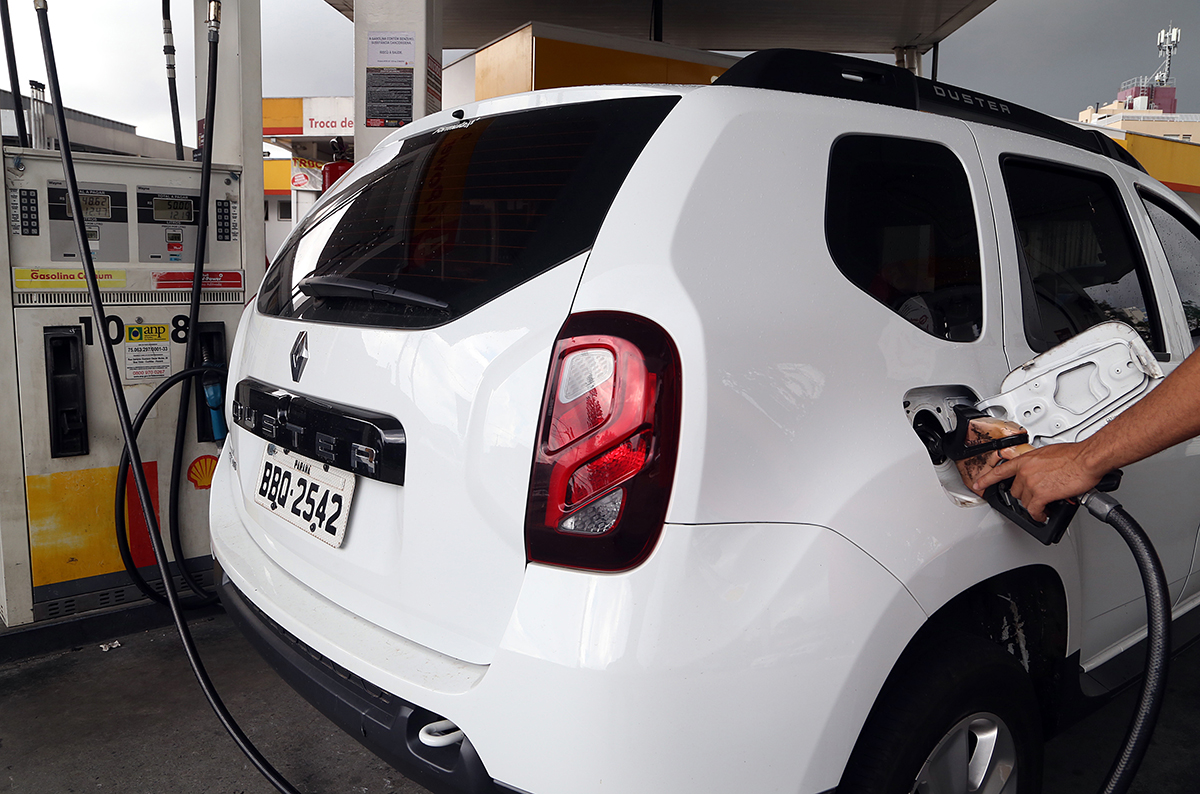
Brazilian economy consumed 6.3 liters for each R$1 produced in 2017


May 07, 2020 10h00 AM | Last Updated: May 12, 2020 10h59 AM
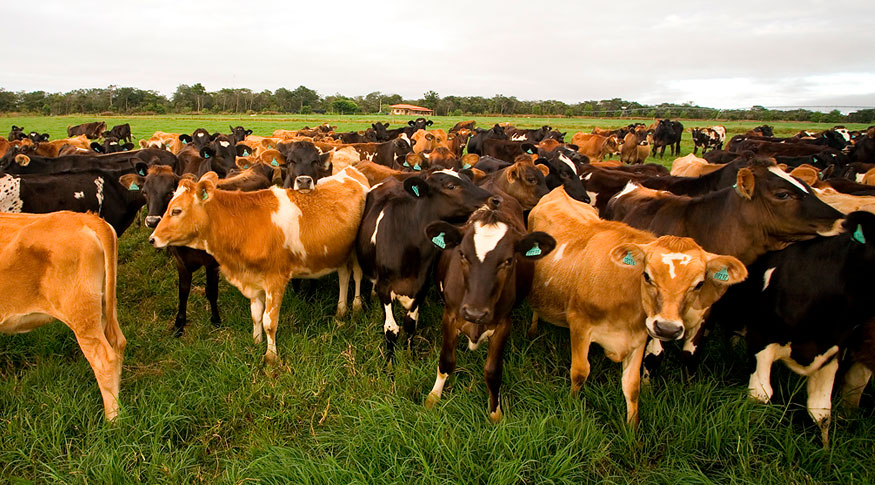
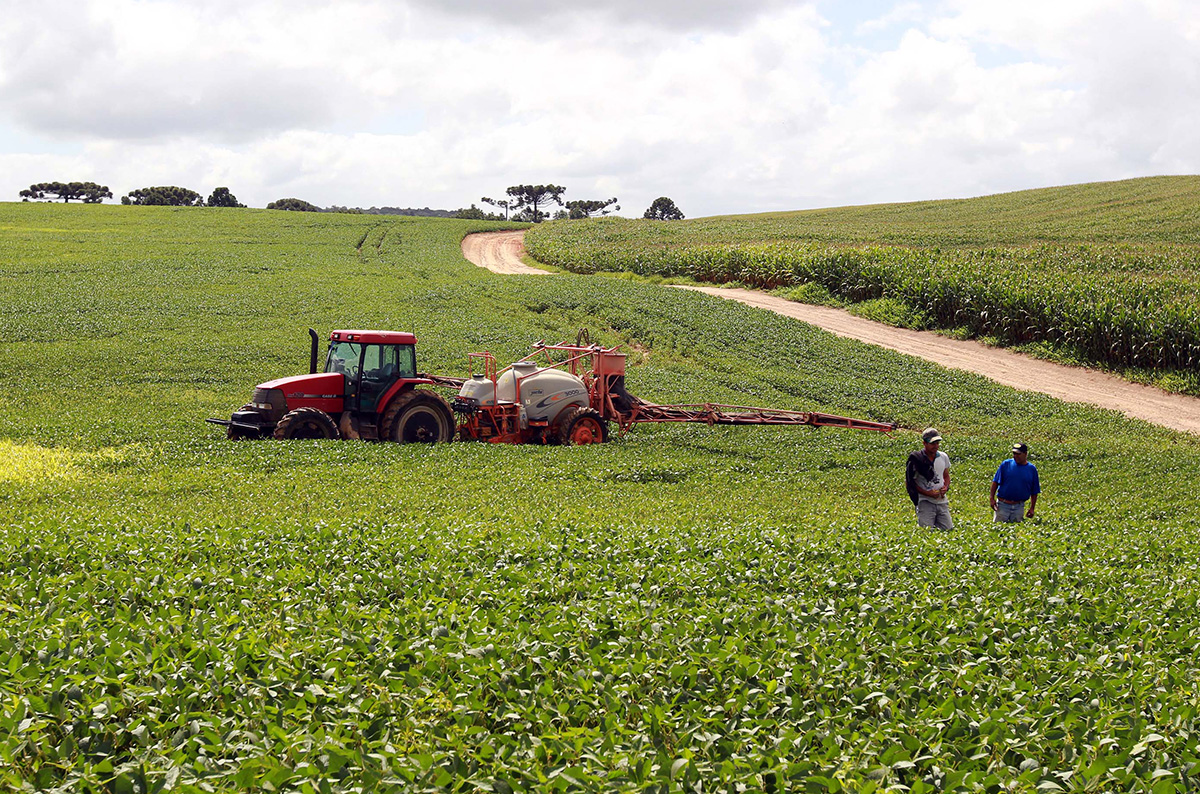
For each R$1 of Gross Value Added produced in Brazil in 2017, approximately 6.3 liters of water were consumed. The activity which demanded more water volume was Agriculture, livestock, forestry, fishing and aquaculture, with 1,061 liters for each R$1 produced. Among the Major Regions, the Central-West recorded the largest water consumption, with 1,511.9 liters/R$1. The data are from the Brazilian System of Environmental - Economic Accounts for Water (SEEA-Water) 2013-2017, released today (7) by the IBGE in partnership with the National Water Agency (ANA).
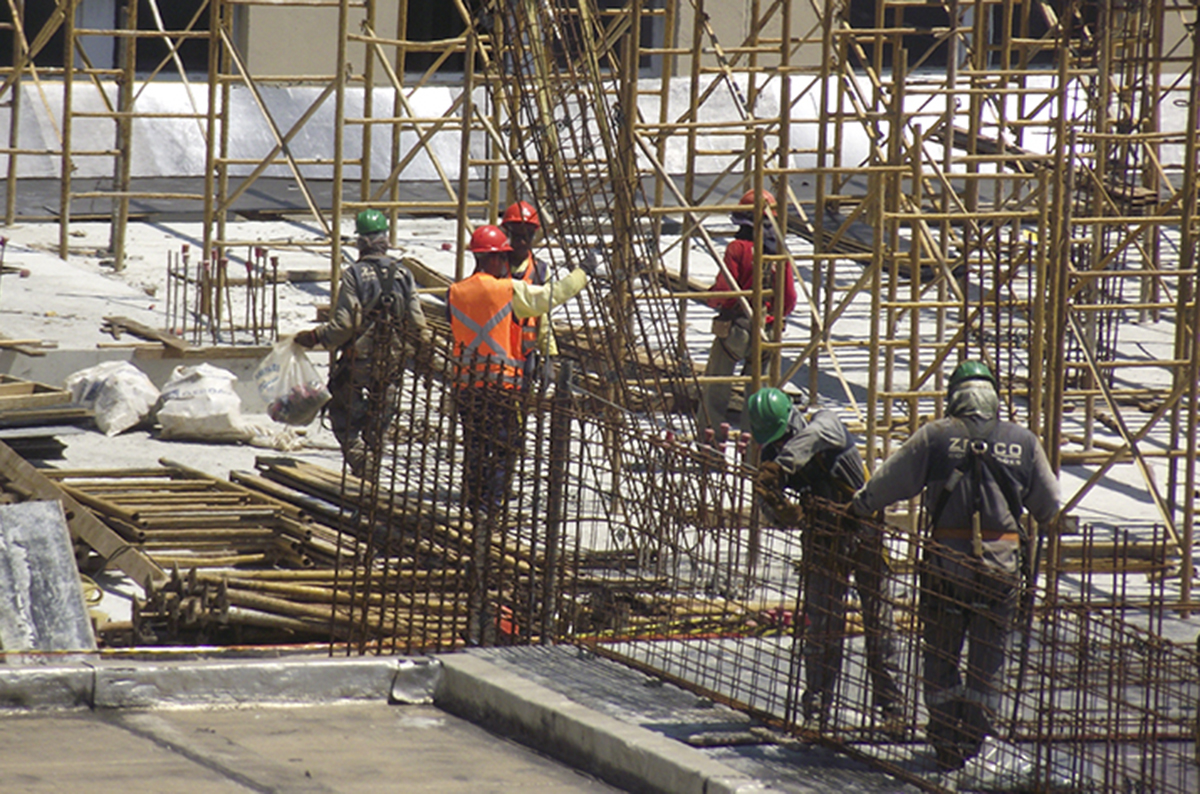
The total water consumption in the year in Brazil, which corresponds to the water used subtracting the portion that returns to the environment, was 329.8 trillion liters. The major influences in the water consumption were Agriculture, livestock, forestry, fishing and aquaculture (97.4%), highlighted by dry farming (non-irrigated); Manufacturing and construction industry (1.0%) and Water and sewage (0.8%).
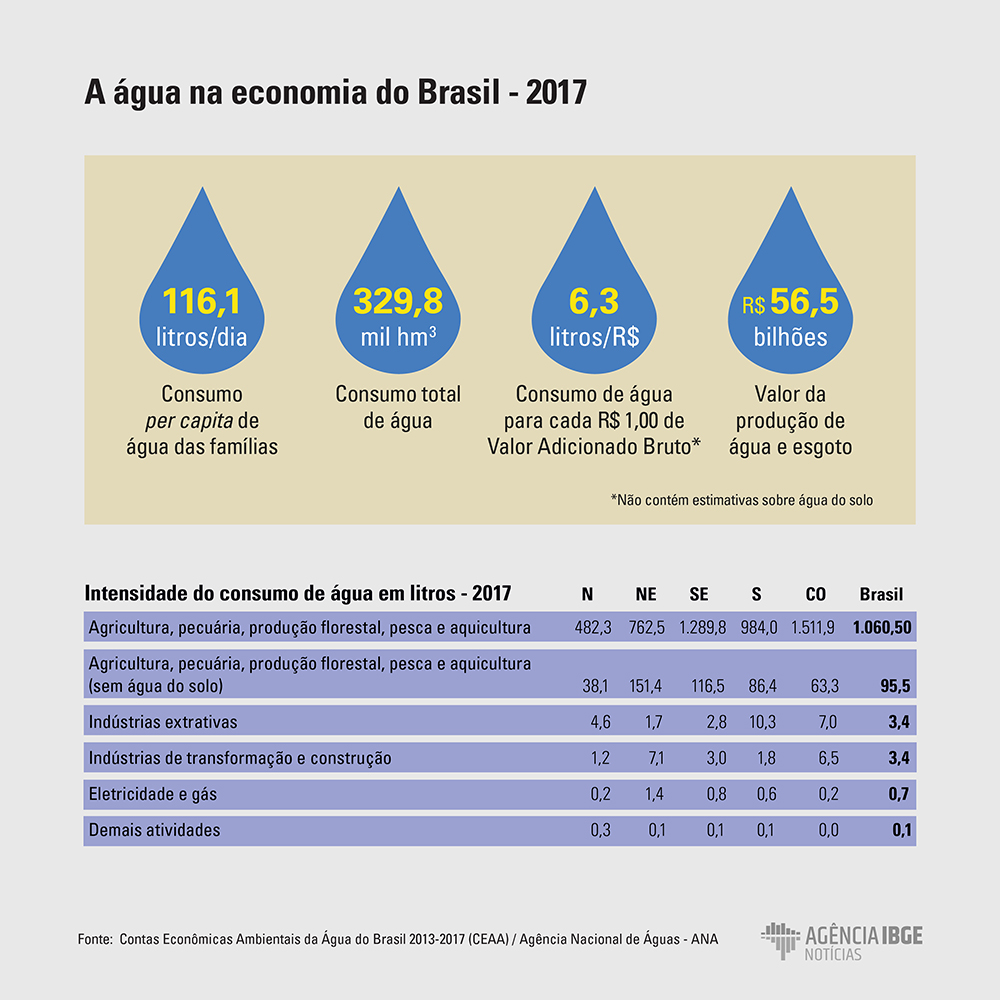
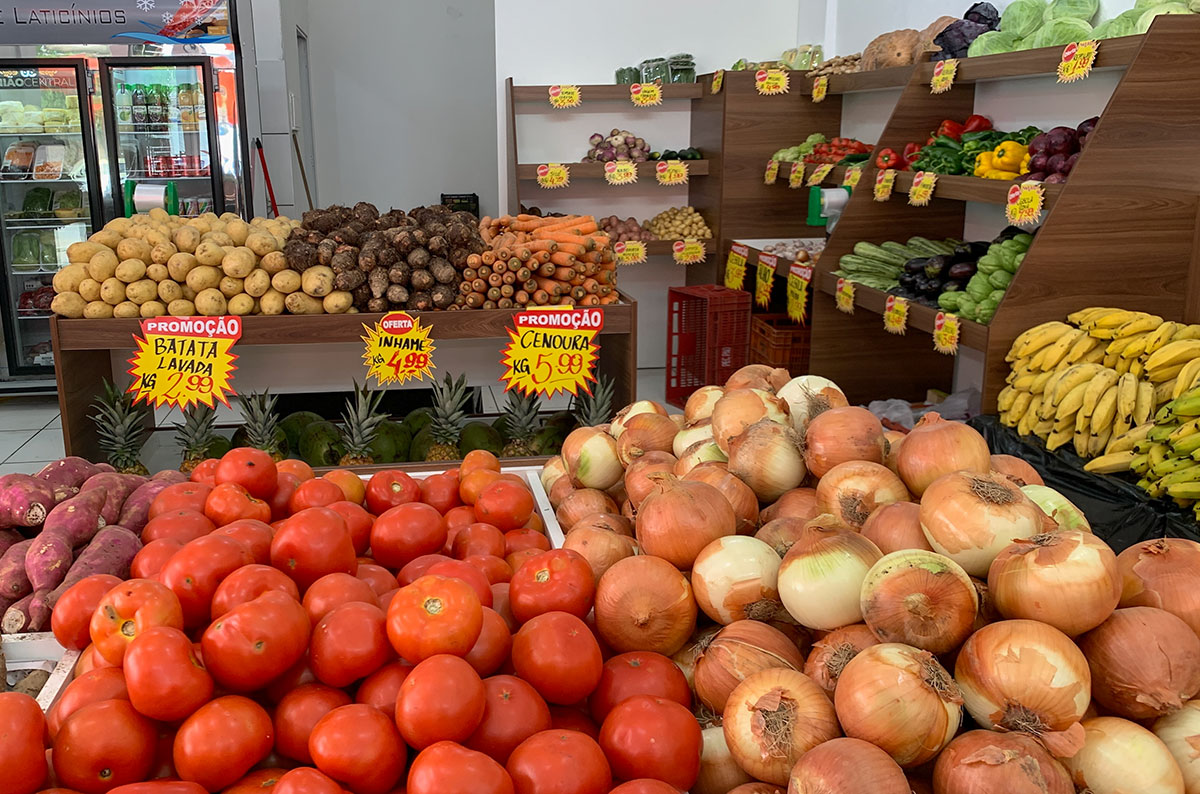
According to the survey, the activity of Water and sewage corresponded to 0.6% of the current Gross Value Added of the whole economy in the year. The production value of the distribution water and sewage services was R$ 56.5 billion, with distribution water responsible for 65.9% of this total. Considering the demand, which means the expenses, Households were the major factors for the use of distribution water (61.5%) and sewage services (62.1%).
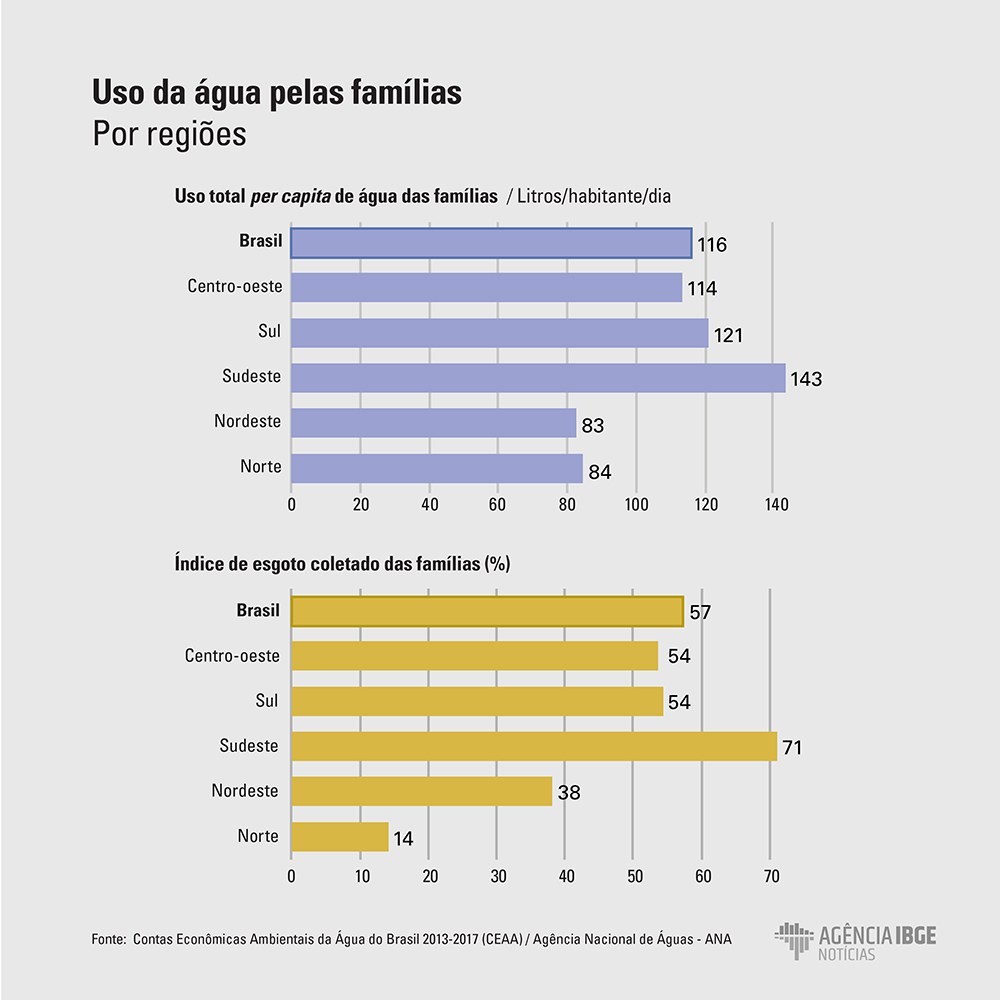
Household water use per capita in 2017 was 116 liters/day
In 2017, the household water use per capita was 116 liters per day. The Southeast recorded the highest use per capita, with 143 liters, while the lowest one was recorded in the Northeast, 83 liters per inhabitant/day.
Regarding the contribution of the sewage volume collected by the sewage network system in relation to the volume of used water, the Southeast was the region which recorded the highest result in 2017, with 71%. In the North region, only 14% of the water used by Households returns to the environment through the collection network system.
“By the first time, we released data per region, which contributes to a better understanding of the particularities of each region in the country,” explains the analyst of the IBGE´s National Accounts Department, Michel Lapip. The first SEAA release, with 2013-2015 data, was revised, updated and extended in this new survey. “Methodological changes contributed to improve the detailing level,” adds the researcher.
For the first time, the survey distinguished the calculation for irrigated agriculture and dry farming. While the first one makes use of rivers and lakes, the last one depends exclusively on rainwater and soil water, covering more than 90% of the Brazilian agricultural area. According to the survey, for each R$1 produced by the economic activity that includes Agriculture, livestock, forestry, fishing and aquaculture, 1,061 liters of water were consumed. Disregarding the soil water volume consumed in dry farming, the indicator changes to 95.5 liters/R$1 in 2017. The figures reinforce the influence of the agrarian activity as the economic sector with the highest water consumption to produce wealth.
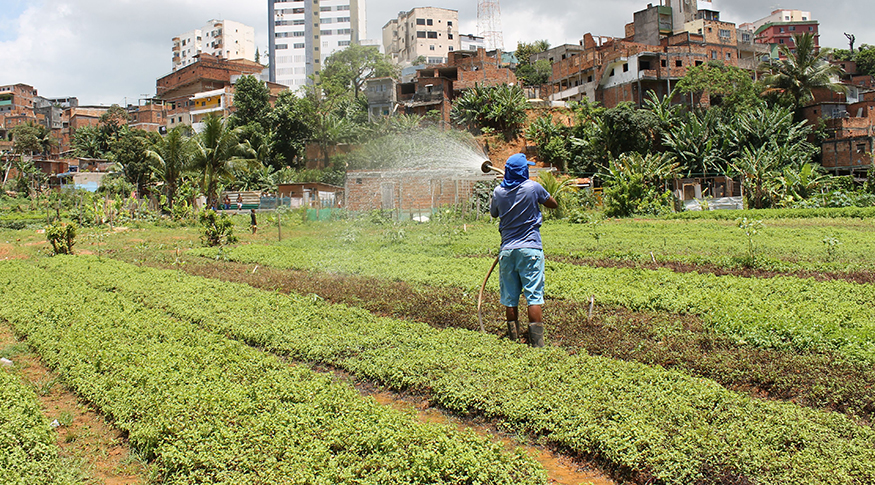
In the Northeast, the irrigated agriculture consumes 151.4 liters of water for each R$1 produced in the activity - the highest rate in regional terms. “The semi-arid climate and the physiological characteristics of the main crops in the region increase this value,” says Lapip. Due to the water volume from the public irrigated perimeters (PIP), the water demand for irrigation purposes surpassed the Northeastern households demand by 30%. The situation is different in all others Major Regions, where Households surpassed the economic activities in terms of the water volume demanded.
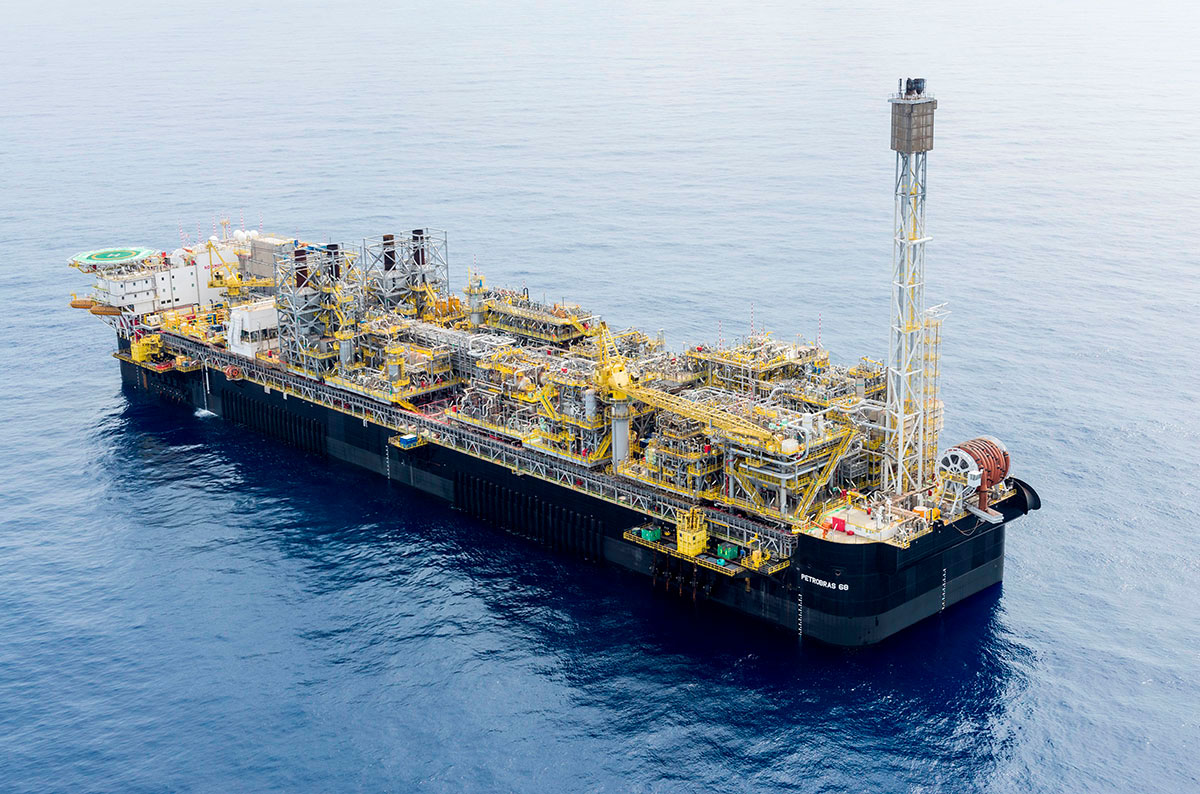
The water demand in the income generation in the mining and quarrying industries was 3.4 liters per R$1, the same level of the manufacturing and construction industries.
Environmental-Economic Accounts for Water
In March 2018, the IBGE, ANA and the Ministry of Environment released the Environmental-Economic Accounts for Water in Brazil - 2013-2015. As of this first release, it was possible to understand with more accuracy the relationship between the water resources and the aggregated value of each economic activity and how the water has a key role in the Brazilian economic development .
The initiative, which is in its second edition, has technical support from the German International Agency for Sustainable Development (Deutsche Gesellschaft für Internationale Zusammenarbeit - GIZ). The main goal is to systematically produce and disseminate information related to the balance between quantitative and qualitative water availability, as well as the water demand by many sectors of the Brazilian economy, including Households.