Summary of Social Indicators
Child education indicators advance, but are still below the target set by the National Education Plan


December 03, 2025 10h00 AM | Last Updated: December 05, 2025 11h06 AM
Highlights
- Gross school attendance rate of the group aged 0 to 3 reached 39.7%, whereas that of the group aged 4 to 5 reached 93.5%.
- In 2024, a child aged 0 to 3 in the Southeast Region had more than twice as many chances than a child in the North Region to attend child education.
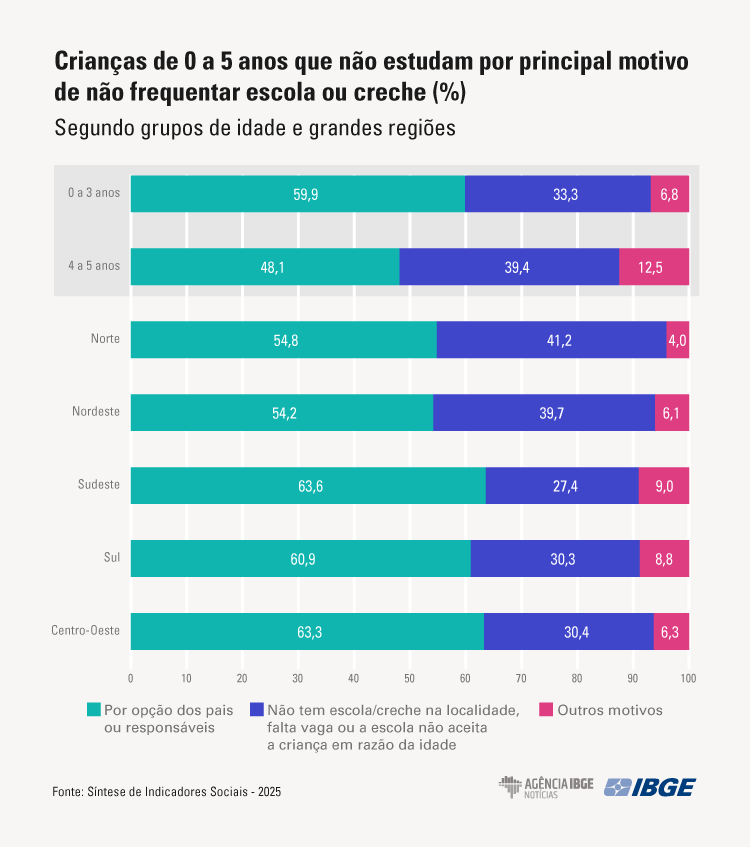
- There was an increase in the percentage of children aged 0 to 5 not attending school by choice of their parents or caregivers, with 59.9% for the group aged 0 to 3 and 48.1% for that aged 4 to 5.
- School failure of children aged 6 to 10 increased, with the Net School Attendance Rate (adequacy between age and grade) falling from 95.7% to 90.7% between 2019 and 2024.
- In 2024, about 8.5 million youngsters aged 15 to 29 and had dropped school without finishing high school.
- The public school system is predominant in child education, in primary school and in high school, but in higher education, the opposite takes place.
- In 2024, the average of students by class in the Brazilian public school system (22.3 in the initial years and 26.6 in the final years of primary school) was higher than the average in the public system of OECD countries (20.8 and 23.1, respectively).
- The Northeast Region recorded in 2024 an illiteracy rate twice as high as the national average (5.3%), with 11.1% of persons aged 15 unable to read or write a simple note.
- In 2024, the average years of schooling of all youngsters aged 18 to 29 was 11.9, an increase of 0.8 years from 2016, very close to the 12 years in Target 8 of the National Education Plan.
In 2024, the gross school attendance rate of persons aged 0 to 3 reached 39.7%, an advance of more than 9 percentage points in relation to the start of the time series, in 2016, whereas in the group aged 4 to 5 it reached 93.5%, an increase of 3.5 percentage points since 2016. These percentages, however, are below Target 1 of the National Education Plan (PNE) in effect until December 31 – universal access to child education by children aged 4 to 5 and at least 50% coverage for children up to 3 years of age. These and other statistical results are part of the chapter on Education in one of the main IBGE studies, Summary of Social Indicators: an analysis of the Brazilian population’s living conditions 2025. The study has two chapters: Economic structure and labor market and Standard of living and income distribution.
In the group aged 6 to 14 years (99.5%), there was a trend to stability. Among youngsters aged 15 to 17 years, the rate had one of its most significant increases, reaching 93.5% in 2024. However, Target 3 of the PNE, broad access to school by this group, was not met. In the group aged 18 to 24 years, the gross school attendance rate in 2024, 31.5%, was the same as in 2016, having returned to this level after drops between 2019 (31.3%) and 2022 (30.6%).
As for gross school attendance of children aged 0 to 3, the Southeast Region (46.8%) surpassed the South Region (44.7%) in 2024, being the leader in this indicator. So, in 2024, a child aged 0 to 3 in the Southeast Region had twice as many chances of access to child education than a child in the North Region.
There was an increase in the percentage of children aged 0 to 5 who were not attending school by choice of their parents or caregivers, this being the most often mentioned reason for both children aged 0 to 3 (59.9%) and children aged 4 to 5 (48.1%) in 2024. The second main reason was lack of schools in the area; lack of vacancies; children not accepted by the school due to their age, 33.3% and 39.4%, and other reasons, with 6.8% and 12.5%.
"In early childhood, the pace of increase of the gross school attendance rate from 2016 up to 2019 was interrupted during the Covid-19 pandemic, but resumed between 2022 and 2024. Despite the advance, the PNE target has not yet been reached. Evidences show that early school attendance can positively influence the history of individuals up to the adult age," said Luanda Botelho, analyst of this study.
School failure increases in the first grades of primary education
Among children aged 6 to 14 anos, the net school attendance rate - TAFEL (which shows age-grade adequacy) has not yet returned to the pre-Covid 19 pandemic level. The TAFEL, which had changed from 96.7¨% to 97.1% between 2016 and 2019, fell to 95.2% in 2022 and 94.6% in 2023, a percentage that remained stable in 2024, below Target 2 of the OPNE, which established that 95% of the students should complete primary education at the proper age.
The decrease of TAFEL from 95.7% to 90.7% between 2019 and 2024 was observed in the population aged 6 to 10, those who should attend the early years of primary education. Besides this decrease, there was a 5 percentage point increase in the proportion of children in this age group attending school, but not at the proper age for the grade attended (from 3.8% to 8.8%).
“A possible explanation to this phenomenon would be delay in children's admission to pre school, a compulsory step of child education, still in the pandemic period, with an effect in the delayed admission to primary school,” Luanda Botelho explained.
TAFEL among youngsters aged 15 to 17 years of age in high school, in turn, increased 3 percentage points between 2016 (68.3%) and 2019 (71.3%) and reached 76.8% in 2024, below the 85% of Target 3 of the PNE. TAFEL for the population aged 18 to 24 years in higher education increased from 23.1% in 2016 to 27.3% in 2024, with bigger increase after the pandemic, having remained, however, below the 33% expected for 2024 according to Target 12 of the PNE.
In 2024, white women had the highest TAFEL for the group aged 15 to 17 years in high school (84.6%) and for the group aged 18 to 24 years in higher education (42.2%), followed by white men (79.1% and 32.8%), then by black or brown women (77.5% and 25.1%) and, at last, by black or brown men (70.1% and 16.9%).
In 2024, approximately 8.5 million youngsters aged 15 to 29 years were not in school, even without completing high school
Specifically between 2023 and 2024, the completion rate of primary school went from 91.1% to 92.4%, whereas the completion rate of high school went from 74.1% to 75.1%. The conclusion of high school carries the biggest difference by sex. Although it fell in the period, this difference was 9.2 percentage points in favor of women in 2024, consolidating a pattern of higher schooling among women.
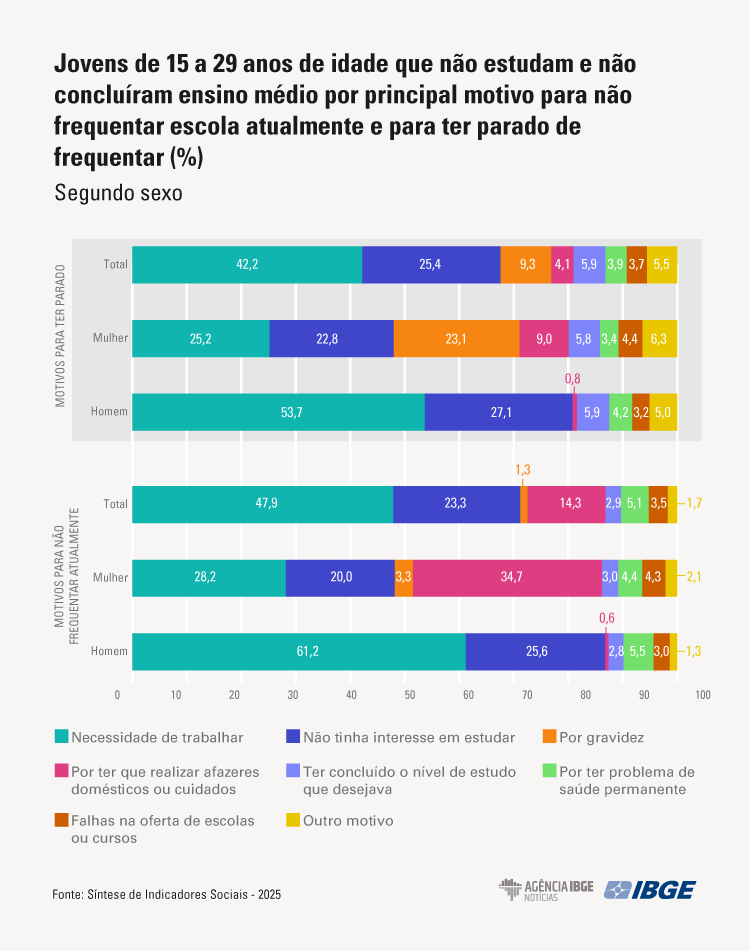
In 2024, approximately 8.5 million youngsters aged 15 to 29 had dropped out of school without finishing high school. It was, however, below what was observed in 2023, 8.9 million. Of the total observed in 2024, 431 thousand were aged 15 to 17 eyars; 4.2 million were aged 18 to 24 years; and 3.8 million, 25 to 29 years. In the case of school dropout by women, in 2024, pregnancy, having to do housework and care for persons represented 32.1%, surpassing reasons such as necessity to work (25.2%) and lack of interest (22.8%). As main reason for non-attendance to school, the first two reasons amounted to 38.0%, once more surpassing the necessity to work (28.2%) and lack of interest (20.0%).
The main reason for school dropout Among men, necessity to work recorded the highest percentages, both as the main reason for school dropout (53.7%), and for not being in school (61.2%). The percentage attributed to domestic work and care was residual for men in both cases, 0.8% for having quit school and 0.6% for not attending school.
Public schools are predominant in child education, primary education and high school
In the three levels of basic education, there is predominance of the public education system, in compliance with the constitutional guarantee of free basic education by the State, from the age of 4 years. The percentages of students attending public schools in child education - in daycare centers and schools –, primary school and high school were 82.2%, 75.2%, 81.4%, 86.5%, respectively. Only in higher education did the private education system served most of the students (74.0%).
In higher education, the opposite takes place. So, while persons in the population quintile with the lowest per capita household income (up to 20%) could represent more than 40% of the students in pre school and primary school in the public system in 2024, in higher education they were underrepresented, and accounted for inly 12% of the public education system. On the other hand, people in the population quintile with the highest income (above 80%) represented 3.6% of the students in the public segment in pre school and primary school, but covered 28.0% of the students in higher education in the public education segment.
The report Education at a Glance 2025 brings the average number of students per class in the initial and final years of primary school for OECD countries in 2023. The comparison with Brazil, with updated data for 2024, reveals that the average of students per class of the Brazilian public education system (22.3 in the initial years and 26.6 in the final years) was above the average in the public education system of OECD member countries (20.8 and 23.1, respectively) in both education levels.
Illiteracy in the Northeast is two times higher than the national average
The Summary of Social Indicators showed significant regional uneveness in illiteracy rates. The Northeast region in 2024 had an illiteracy rate two times higher than the national average of 5.3%, with 11.1% of the persons aged 15 and over unable to read and to write a simple note. The Federation units in the Northeast Region recorded the highest illiteracy rates, with Alagoas and Piauí recording the highest rates in the country, 14.2% and 13.8%, respectively. Rio de Janeiro, Santa Catarina and the Federal District had the lowest illiteracy rates in 2024, with 2.0%, 1.9% and 1.8%.
Although the general trend of older age groups is to have a higher illiteracy rate, the relation between age and illiteracy is not the same in different population groups.
In the highest income quintile (over 80%), the illiteracy rate for the first four age groups, up to 49 years old, was practically the same, of up to 0.3%. In this population quintile, the illiteracy rate only exceeded 1.0% in the groups aged 60 and older, reaching a maximum of 7.3% for those aged 80 and over.
On the other hand, in the population belonging to the lowest income quintile (up to 20%), although the illiteracy rate among people aged 15 to 24 was below 1.0%, it reached 1.9% in the next age group (25 to 29 years old) and increased sharply in the subsequent age groups, reaching 33.5% amon those 80 years of age and over.
With 11.9 years of schooling, youngsters aged 18 to 29 years almost reached the PNE target
In 2024, the average years of schooling for all youngsters aged 18 to 29 was 11.9, an increase of 0.8 years from 2016, very close to the 12 years of Target 8 of the PNE. The biggest disparity remained between youngsters with lower and higher incomes. In 2024, those aged 18 to 29 in the lowest 25% income group had an average of 10.6 years of schooling, and only 55.0% had reached the 12 years set by Target 8, whereas in the highest income group, the average was 13.5 years of schooling, and the proportion who reached 12 years was 91.9%.
Mais sobre a pesquisa
The Summary of Social Indicators: an analysis of the Brazilian population's living conditions 2025 aims to systematize and present a set of information related to the social reality of the country, based on highly relevant structural themes. In this edition, the topics are organized into three fundamental and complementary axes: Economic structure and labor market; Standard of living and income distribution; and Education. Additionally, in this edition, groups of occupation, the profile of older adults in the labor market, and a study on poor workers, also known as the Working Poor, are addressed.