Air Links
Study shows status of the aviation sector in Brazil and impacts of Covid-19
December 10, 2021 10h00 AM | Last Updated: December 14, 2021 02h39 AM
Highlights
- In 2020, regular flights transported 44 million passengers in Brazil and more than 282 thousand metric tons of cargo was moved to and from Brazilian airports.
- Passenger transportation was the most affected mode by the pandemic in 2020, with a decrease of 53%, whereas movement of cargo fell by 29.6%.
- Only 46 cities in Brazil had at least one regular passenger flight per month in 2020.
- São Paulo is the major national air hub, as a destination, place of departure or intermediate spot for connections of passengers or cargo.
- São Paulo, Manaus, Brasília and Campinas hold more than 85% of the entire air cargo transported in 2019.
- Destinations in the South and Soiutheast have cheapest weighted fares.
- Geographic accessibility of cities in Amazonas is the lowest.
The impact of the Covid-19 panemic on the natioal aviation sector in 2020 led to the decrease of 53% in the number of passengers and of 29.6% in cargo transportation from 2019. As a result, the number of travelers fell from 93.8 million to 44 million, whereas the amount of cargo fell from 400 thousand metric tons to 282 thousand metric tons.
Similarly to the commercialization of seats, air fares also fell over the year. Data come from the study Territory Flows and Networks: Air Links (2019-2020),, released today (10) by the IBGE. The product is also available at the Interactive Geographic Platform (PGI), where the user can combine data and download tables and maps.
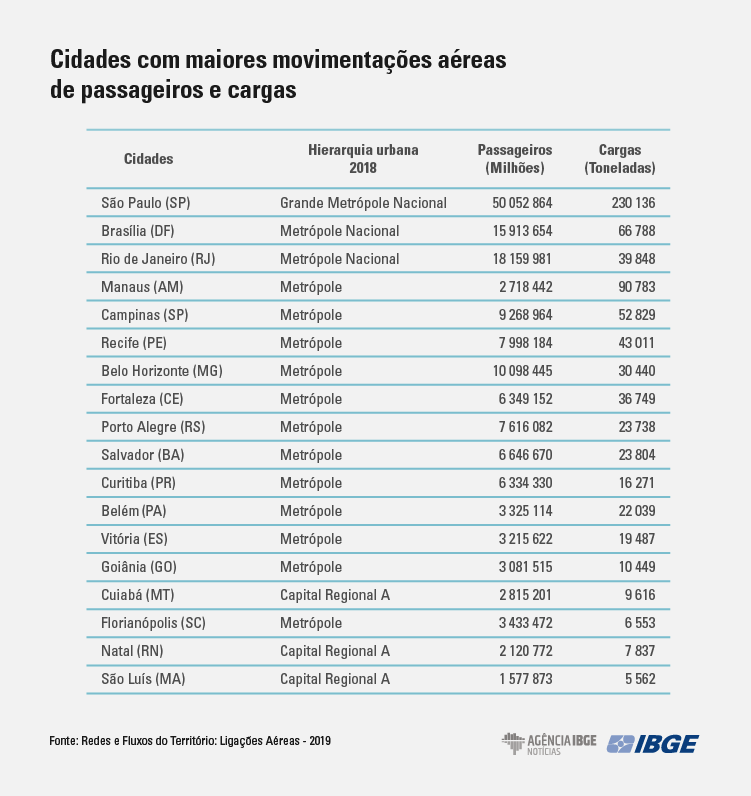
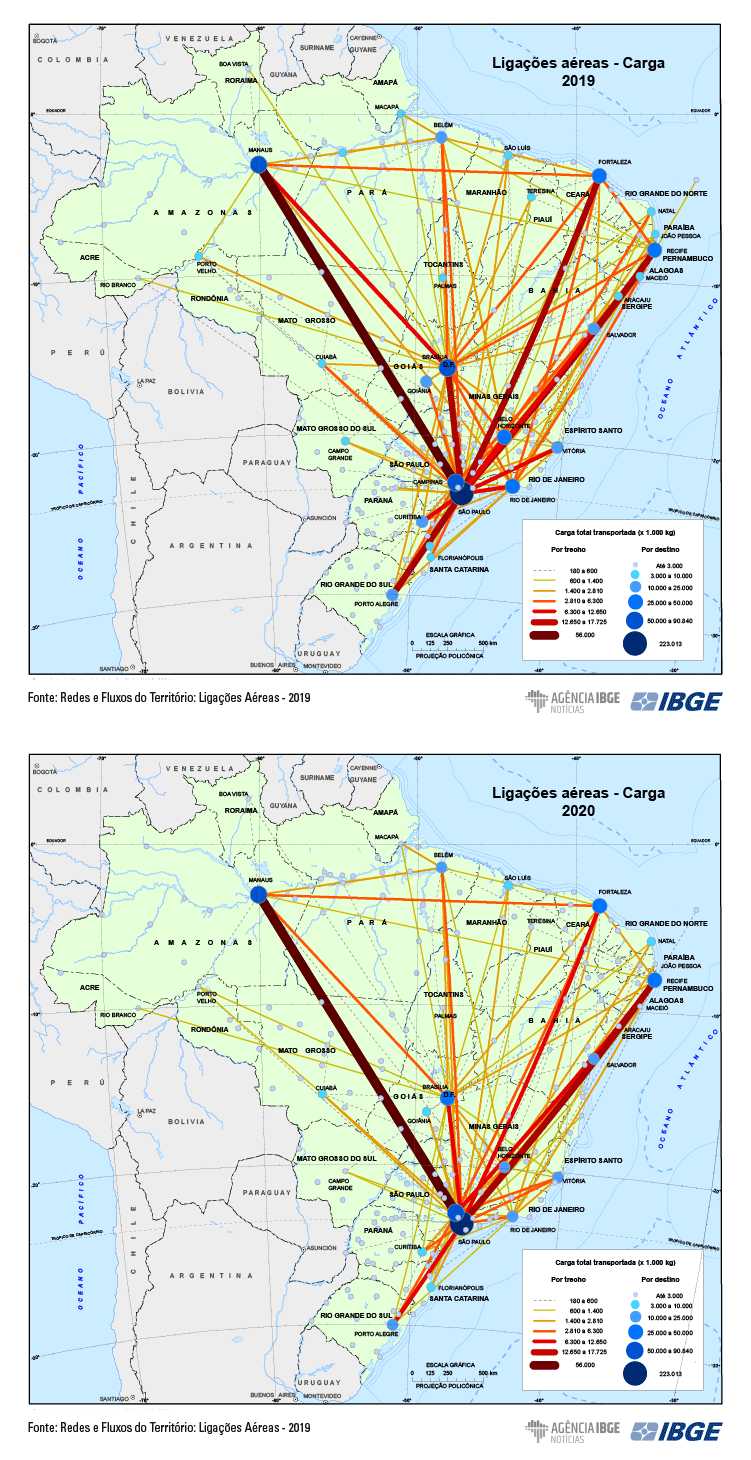
Among the cities, Curitiba was one of the mostly affected ones in terms of cargo movement (a decrease of 52.9% in 2020) and transportation of passengers (-60.9%). Campinas, in turn, had a positive balance of 36% in volume of sales, thus confirming its relevant role in cargo operations in the country. This metropolis, located in the state of São Paulo, became the third biggest city in terms of air transportation of cargo, only second to São Paulo and Manaus, being followed by Recife – since Brasília, which was once in the third position, fell to the fifth one after having its cargo flow reduced by 49.7% of the total in 2020.
“The analysis makes it clear that São Paulo é is the main national air hub, no matter if as a destination, place of departure or intermediatte spor of connection for passengers and cargo,”, says geographer Thiago Arantes, who is in charge of the survey. In 2020, the Great National Metropolis, which houses the airports of Congonhas and Guarulhos, accounted for 50.3% of the air movement of passengers and of 52.2% of all the cargo transported that year.
Altogether, 175 Brazilian cities had some regular flight of passengers or a flight moving cargo as a paid service in 2002, but only 46 had at least one regular flight of passengers each month of the year. “As it is a mode of high technological intensity with a high cost of operation, air transportation tends to be concentrated in big cities, such as metropolises and regional capitals,” the specialist highlights.
Cities in the South and Southeast have bigger economic accessibility
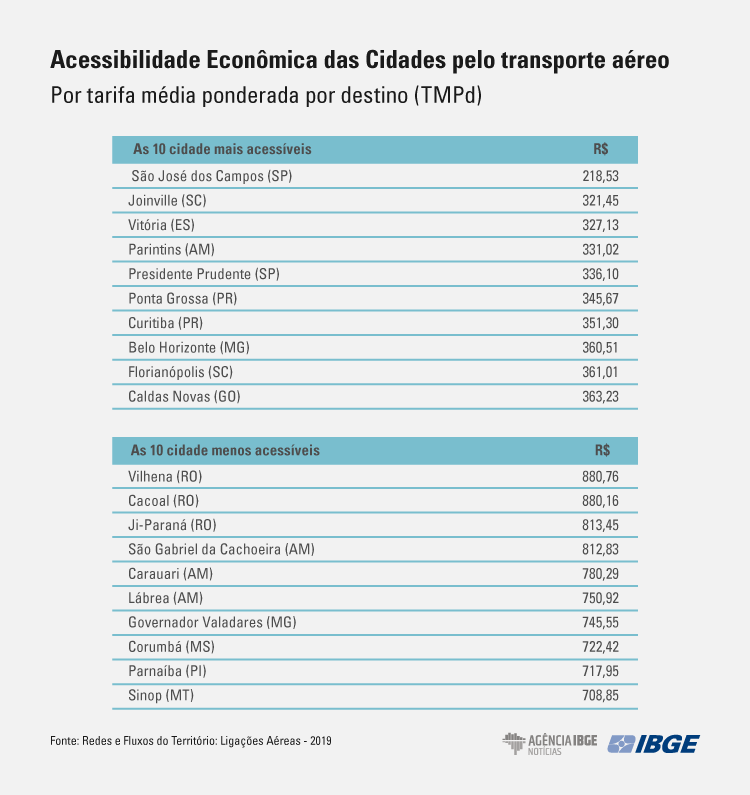
As for the criteria of economic accessibility developed in the study, which takes into consideration all the air fares sold in the years of 2019 and 2020, the most expensive destinations to fly to are cities in the middle of North and Central West regions, especially those in the state of Rondônia, such as Vilhena (RO), Cacoal (RO) and Ji-Paraná (RO), together with the cities in Amazonas: São Gabriel da Cachoeira (AM), Carauari (AM) and Lábrea (AM). All of them have weighted average fares above R$ 750. On the other hand, cities located in the central south of the country with lower offer of destinations and establising connections with closer cities have an average weighted fare below R$ 330, such as São José dos Campos (SP), Joinville (SC) and Vitória (ES).
Besides the economic criteria, other dimensions of accessibility of cities were investigated in the survey, such as the geographic dimension (a reference to the regional air service and the range of destinations) and the temporal dimension (average time spen to reach tje airport and of direct flights offered).
When mapping the temporal accessibility of the main direct flights of each city with an airport, we clearly see the concentration of sorter flights in the Southeast and South of the country, as well as they are attracted to the flow of other Major regions. For example, the network of relations in the central-south axis concentrates most links with an average time ranging between 34 and 110 minutes, whereas connections of the cities in the North and Northeast with this portion of the national territory may range, most of the time, between 150 and 290 minutees per trip.
In relation to geographic accessibility, the city of São Paulo is a highlight with a total of 49 choices of destination that are accessed by means of direct flights or other 27 destinations by means of stopovers or connections. Campinas is in the second position, once it had two options less of direct flights, despite having one more option of flight than the capital.
“Another highlight is the city of Manaus, which has a total destinations more than São Paulo, since ot has a local network of flights to lowes cities in its own state, areas that are mainly accessed by waterway or air,” Mr. Arantes adds.
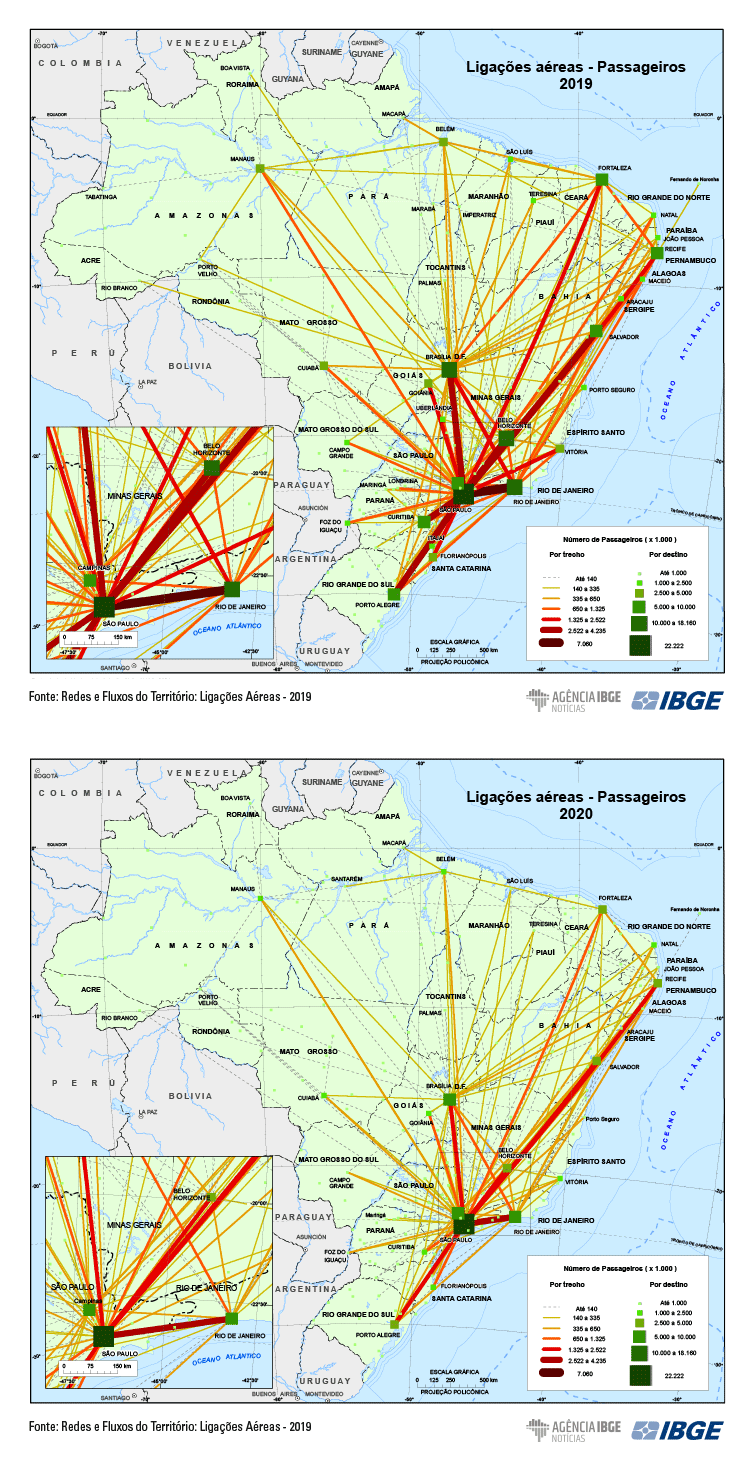
Among the cities with lowest geographic accessibility are Lábrea (AM), São Gabriel da Cachoeira (AM), Carauari (AM) and Parintins (AM). Located in the middle of Amazonas and with a limited road network, these cities are more dependent on the waterway or ai transportation mode to tranport their residents – who only have ticket options to Manaus, where they need another air tocket in ordert to travel to any other destination.
Evolution of air transportation took plce in two steps in the last decade
Air transportation of passengers progressed in the 2010’s in terms of two stages: sustained increase between 2010-2015, followed by slight retraction in the 2015-2019 period. The country as a whole recorded an increase of 37.4% in the first half of the decade, with highlight to the consolidation of Campinas (SP) as the fourth major force in air transportation of passengers, with an increase of 85.6%.
Another highlight is the strenghtening of cities of Itajaí-Balneário Camboriú (SC), of Foz do Iguaçu/Brasil-Ciudad del Este/Paraguai and Porto Seguro (BA), with increases in air movement of passengers by 76.3%, 80.7% and 73.4%, respectively. The cities of Salvador (BA), Natal (RN) and Recife (PE) were the ones with the lowest evolution in the first part of the decade, nou exceeding 20% of increment between 2010 and 2015.
Between 2015-2019, the overall scenario of air movement of passengers was marked o by a decrease of 1.0%, with stagnation in some cases or slight increase in others. Of the cities on top of the urban hierarquy (metropolises), the one that calls attention the most is Salvador, with a decrease of 20.2%. Its network, which, in 2010, had 38 direct flights, was reduced to 32 in 2019.
On the other hand, Recife had an increase in passenger movement by 24.8% in the period 2015-2019, having recovered from the drop oin the previous period. Its air network recorded a decrease from 32 to 30 direct flights between 2010 and 2015, and saw its options jump to 42 direct flights in 2019, an indication of the strength of property of regional hub in the capital of Pernambuco.
Whereas there was increase in passenger movement between 2010 and 2015, movement of cargo in the same period fell by 10.8%. The city of Manaus (AM) accounted for a negative contributiom in the period, with a decrease of 30.1% in its movement of cargo. However, the capital of Amazonas recovered in the second half of the decade, by means of restructured flows, and a decrease of the weight of interaction with the capital of São Paulo by improvingb its relationship with Campinas. The connection between the two cities grew by 2,356% between 2015 and 2019, thus helping consolidade the position of the city that, together with São Paulo (SP), Brasília (DF) and Manaus would account for more than 85% of all the cargo moved in the year 2019.
The second half of the decade (2015-2019) witnessed an overall increase of 14.2% of transported cargo, with all the connections made more intense and the establishment of secondary connections between cities in the Central West and the cities of Campinas and São Paulo.
About Territory Flows and Networks
The project Territory Flows and Networks represents a permanent line of investigation by the IBGE, and analyzes the relationships and connections linking cities in the country, their accessibility and the spatial configuration of this interchange, either of material nature (persons, goods, cargo) or immaterial nature (information money, management). The 4,889 cities covered by this study are individual municipalities or groups highly integrated municipalities, population arrangements, such as the city of São Paulo, which is composed of 37 municipalities.
The specific study Air Links 2019-2020 is based on records from the National Civil Aviation Agency and from the Civil Aviation Secretariat of the Ministry of Infrastructure, besides surveys conducted by the IBGE itself. This investigation describes and analyzes the central character and connections of Brazilian cities considering air transportation, by means of passenger and cargo flows. The latest edition presents a sequence to the 2010 study, and shows the evolution of air transportation in the last decade.


