POF 2017-2018: 72.4% of Brazilians lived in households that had trouble paying for monthly expenses


August 19, 2021 10h00 AM | Last Updated: August 21, 2021 02h10 AM
Approximately 72.4% of Brazilians lived in housing units having trouble paying for monthly expenses, being 44.4% of that population members of households with a black or brown reference person and 27.0% members of households with a white reference person.
In Brazil, 83.3% of the population lived in households in which a member had access to main financial services: percentages were 66.2% for a current account; 49.9% for a credit card; 55.9% for a savings account and 19.5% for overdraft protection.
These data come from the Consumer Expenditure Survey (POF) 2017=2018 – Profile of Expenditures, which covers, in this edition, the access by the population to financial services, monetary and non-monetary expenditure relative to food, transportation and leisure. There is also information about how householders see their living conditions.
The proportion of the population living in households in which none of the members had access to at least one of the aforementioned banking services was of 16.7%, being 11.7% members of households with black or brown reference persons and 4.8%, members of households with a white reference person.
Per capita household expenditure on selected financial services, in the country, amounted to R$ 124.79. Payment of loans, real estate in installments, cars and motorcycles represented 76.5% (R$ 95.51) of those expenses. The contribution of families headed by a white person to per capita expenditure on financial services (R$ 73.62) was significantly higher than that of households with a black or brown reference person (R$ 48.91).
In Brazil, 46.2% (95.6 million) of Brazilians were members of households that had at least one overdue bill per month, as a result of financial difficulties. Water, electricity or gas bills recorded a higher percentage as they were associated with the concentration of persons living in households with overdue payments (37.5%), against 26.6% for goods and services and 7.8% for rents or installments of real estate.
Among the 41.0% of the population living in households facing food insecurity, 28.4% were members of households with a black or brown reference person and 12.1% of households with a white reference person.
Per capita household expenditure on transportation amounted to R$ 85.44, being 71.2% relative to private transportation, taxis and ride-sharing and 20.6% relative to collective means of transportation. In households with a black or brown reference person, the contribution to per capita expenditure on collective transportation (R$ 10.30) exceeded the contribution from households with a white reference person (R$ 7.01).
The average per capita expenditure of the population on travel and leisure was R$ 53.93.
Expenditure on travel and leisure of households with a white reference person (R$ 34.41) was almost twice as the average per capita expenditure in the country, in comparison with the contribution from households with a black or brown reference person (R$ 18.35).
662% of the population lived in households with a person that had a current account
POF 2017-2018 shows that 83.3% of the Brazilians were members of households in which at least of the members had access to one of the financial services analyzed. The biggest percentage was that of the current account: 66.2% of the population were members of households that had access to this type of service. Savings account (55.9%) was in the second place. Households that reported expenses or payments from insurance services held 35.3% of the population, whereas operations with loans and installments of real estate, cars or motorcycles held 32.1%. Among the 83.3% of the population that lived in households in which at least one member had availability of at least one of the financial services, 37.1% were in the Southeast and 20.4% in the Northeast.
The proportion of the population living in households in which none of the members had access to at least one of the aforementioned banking services was of 16.7%, being 11.7% members of households with black or brown reference persons and 4.8%, members of households with a white reference person.
Most users of financial services are in the Southeast
The Southeast had 18.9% of the population living in households in which at least one of the members spent on bank charges, overdraft protection interests and credit cards in the period analyzed. The Northeast (7.9%) was number two in terms of concentration, but the South, with a much smaller population, had a similar percentage (6.8%). In the Central West (4.1%) and in the North (1.9%) these expenses did not reach 5% of the population.
In transactions that refer to borrowing or lending of loans, and expenditure on installments of real estate, cars and motorcycles, the Southeast is also the leader (12.8%), but the percentage in the Northeast (9.4%) was twice as that in the South (4.7%). The Central West (3.0%) and the North (2.2%) were in the last two positions.
The concentration of the Brazilian population living in households in the Southeast that had expenses or payments from insurance services amounted to 18.0%, 7.6% in households in the South, 5.9% in the Northeast, 3.0% in the Central West and 0.8% in the North.
Households with a white reference person spend more on financial services
Per capita household expenditure on selected financial services amounted to R$ 124.79. Payment of loans, real estate in installments, cars and motorcycles made up 76.5% of those expenses, or R$ 95.51 per resident.
The contribution of households headed by a white person to per capita expenditure on financial services (R$ 73.62) was significantly higher than that of households with a black or brown reference person (R$ 48.91). The contribution to monthly per capita figures from investments by households with a white reference person (R$ 76.63) was more than three times that of households with a black or brown reference person (R$ 24.69).
52.2% of Brazil and lived in households without a car
Ownership of durable goods has positive impacts on the well-being of households Besides cars and motorcycles, some equipment have been grouped according to their type of use: a) Kitchen and laundry (stove, refrigerator, washing machine, etc); b) Furniture (sofas or armchairs, etc.); c) TV and computer science; d) Sound or media (stereos, DVD/Blue Ray, etc.).
In Brazil, 40.3 million persons (19.5% of the population) lived in households with all the equipment mentioned: 75.5% lived in households with furniture; 67.4% in homes with some type of stereo or media; 45.3% in households with a kitchen and laundry and 41.9% in homes with TV and computer equipment.
From the 19.5% of the population that lived in households with all the selected equipment, 11.6% of the population were members of households headed by a white person and 7.5% were members of households headed by a black or brown person.
About 52.2% of the population lived in households without a car; 37.5% in households with one car and 10.3% in households with two or more cars. About 75.0% of the persons lived in households in which none of the members had a motorcycle.
Among the 52.2% of the population that were memebers of households without a car, 36.0% were also in households with a black reference person and 15.6% in households with a white reference person. As for the 75.0% that lived in households without a motorcyce, 41.7% were members of households with a black or brown reference person and 32.1% were in households with a white reference person.
About 50.7% of the expenditure on durable goods was on electric appliances
Between 2017 and 2018, average per capita expenditure on durable consumer goods was of R$ 37.08. Most of that (50.7% or 18.80) was spent on the acquisition of electric appliances and equipment. Another 38.8% (R$ 14.37) were spend on furniture; 5.5% (R$ 2.05), on non-electric equipment and 5.0% (R$ 1.85), on decoration items./p>
46.2% of the population lived in households that reported having an overdue bill
POF also investigated if the household went through financial difficulties in the period of reference, and as a result, it delayed the payment of some other bill such as rent or installments of real estate. water, electricity of gas, etc. About 46.2% (95.6 million persons) of Brazilians were members of families that had at least one of the bills overdue.
Households that reported having overdue water, electricity or gas bills held 37.5% of the population, in the case of rendering of goods and services, 26.6% of the population and, with lower occurrence, overdue rent of installments of real estate, 7.8% of the country’s population.
Among the 46.2% of the population living in households with overdue bills, 26.0% were also members of households whose reference person had finished elementary school and only 3.8% were members of households whose reference person had a higher education degree.
14.1% of the population lived in households facing trouble paying their monthly expenses
POF asked interviewees’ opinions on the difficulty to make it through the month considering their household income. In Brazil, 14.1% of the persons lived in housing units facing a lot of difficulties, 58.3% having difficulty, 26.5% where it was easy and 1.1% where it was very easy to make it through the end of the month. 72.4% of the population lived in households facing some trouble paying for their monthly expenses.
Members of households with a black or brown reference person reported having more trouble paying for their monthly expenses: 9.7% of the country’s population living in these households reported having a lot of trouble and 34.7% reported having some trouble, adding up to 44.4% having some degree of trouble.
Among the members of households with a white reference person, 4.2% of the population in the country lived in households that had a lot of trouble and 22.8% in households that had some trouble, adding up to a total 27.0% of the Brazilian population having trouble paying for their bills in households headed by white persons.
Average monthly expenditure on food is R$ 209.12 per person
In Brazil, per capita expenditure on food was R$ 209.12 per month, being R$ 183.03 relative to monetary contribution (87.5%) and R$ 26.10 to non-monetary contribution (12.5%). The average expenditure on food per person in the household amounted to R$ 147.45 (70.5%) and out of the household, R$ 61.68 (29.5%).
Households with a male reference person accounted for 62.3% (R$ 130.18) of the total expenditure on food, whereas households with a female reference person accounted for 37.7% (R$ 78.94). The contribution of families headed by white persons was of 50.6% (R$ 105.89) and that of households headed by blacks or browns amounted to 47.6% (R$ 99.45).
Households with a black or brown reference person face higher food insecurity
Food security has been discussed in a previous publication of POF 2017-2018. About 41.0% of the population had somewhat limited access to adequate food in quantity and variety.
The proportion of Brazilians that lived in households with severe or moderate Food Insecurity reached 13.9%. Considering percentage points, 6.0% were in the Northeast, 3.8% in the Southeast, 2.5% in the North, 0.9% in the Central West and 0.8% in the South.
Among the 41.0% of the population living in households facing food insecurity, 28.4% were members of households with a black or brown reference person and 12.1% of ones with a white reference person. Among the 13.9% of the population living in households with moderate Food Insecurity, 10.5% lived in households with a black or brown reference person and 3.3%, in households with a white reference person.
Expenditure on private transportation is three times as that on collective transportation
Per capita household expenditure on tranportation amounted to R$ 85.44. R$ 60,81, contra R$ 17,57 para transporte coletivo e R$ 7,06 para transportes alternativos e outros.
In households with a black or brown reference person, the contribution to the per capita expenditure on collective transportation (R$ 10.30) exceeded the contribution from households with a white reference person (R$ 7.01). Regarding private transportation, taxis and ride-sharing, however, the opposite took place: per capita contribution from households with a white reference person (R$ 35.22) was bigger than that of households with a black or brown reference person (R$ 24.39).
4.7% of the population was employed and spent more than one hour on the way to work
About 34.6% of the population was employed and reported spending up to 30 minuts to get to work, whereas 8% spent from 30 minutes to one hour from home to work, and 4.7% more than one hour. The proportion of workers who spent up to 30 minutes on the way to work was bigger in the Southeast (13.7%) and smaller in the North (2.8%) and the Central West (2.9%).
From the 34.6% of the population that spent up to 30 minutes to get to work from home, 12.9% were relative to those in households whose reference person was a woman, and 21.7% referred to members of households headed by a man.
This difference in mobility increases in the case of longer paths: considering the 4.7% dof the Brazilian population that spends more than one hour to get to work, 2.9% percentage points referred to households where the reference person was a man and 1.8% where the reference person was a woman.
Members of households with a black or brown reference person prevailed among the 4.7% of the population that was employed and that spent more than one hour to get to work, representing 2.8 % percentage of that figure, against 1.8% for persons that were members of households with a white householder.
35.7% of the population lived in households that considered collective transportation good and 22.2% that found it bad
POF 2017-2018 also investigated the opinion of households on collective transportation About 77.9% of the persons lived in households that used some type of collective transportation and 22.1% reported not having access to it.
About 35.7% lived in households that considered collective transportation good, 20% as satisfactory and 22.2% as bad. Considering the 22.1% of the population in households that reported not having access to collective transportation, 14.3% were relative to those that lived in urban areas and 7.8%, in rural areas. The proportion of persons in the population that lived in households with access to collective transportation and lived in rural areas (7.0%) was below that if those that had no access (7.8%).
Per capita expenditure on travel and leisure amounted to R$ 53.93
The average per capita expenditure of the population in travel and leisure was R$ 53.93 The remaining (27.6%) was spent on other activities such as reading, tickets for entertainment, sporting and recreation events, besides toys and games. The South recorded the biggest participation of expenditure on leirure, 30.2%; the North, the smallest, 22.7%, and, consequently, a bigger parcel of expenditure on travels, 77.3%.
From the R$ 14.87 of per capita expenditure on leisure, R$ 9.49 (63.8%) referred to cultural, sports and recreation events and R$ 5.38 (36.2%) to reading, toys and games. Considering the R$ 39.05 spent on travels, R$ 28.67 (73.4%) were spent on food, transportation and lodging. The remaining, R$ 10.38 (or 26.6%), was relative to excursions and events and national and international tourism packages.
Income, color, sex and level of schooling of the reference person have an impact on the expenditure on leisure
The contribution to per capita expenditure on leisure and sporadic travels that were among the 10% richest reached R$ 26.43 by person in the population, whereas in households that were among the 10% lowest income, per capita income was of R$ 0.84. Similar disparity can be seen in households whose reference person has a higher education degree (R$ 27.08) and persons without schooling (R$ 1.07).
Monthly per capita expenditure on travel and leisure in Brazilian households amounted to R$ 53.93. With these figure decomposed, for households with a white reference person, the contribution was of R$ 34.41, whereas persons with a black or brown reference person amounted to more than half of that figure: R$ 18.35.
A similar difference was observed among the contributions to per capita earnings on leisure and sporadic travels, with R$ 18.12 for households headed by women and R$ 35.80 for households headed by men per resident of the country.
35.1% of the population lived in households that considered their pattern of leisure good; 34.1% saw it as bad
POF 2017-2018 also reported how of household members saw their quality of life in relation to leisure About 35.1% of the persons belonged to households that evaluated their living pattern as good in relation to quality of public and private leisure services accessed by household members in the period. Another 30.7% considered that aspect as satisfactory, and 34.1%, as bad.
Among the 35.1% of persons in households that considered their leisure pattern good, 16.5% were members of households headed by white persons and 18.2% were members of households whose reference person was black or brown. The difference between the two segments was bigger: 34.1% of the persons who were part of households that saw their leisure pattern as bad, 12.1% were from households with a white reference person and 21.6%, with a black or brown reference person.
Among the 10% households with the highest income, 54.0% of the persons were in households that considered their leisure pattern good and 14.0% in households that saw it as bad. On the other hand, among the 40% of the population with the lowest income, only 29.0% were members of households that considered their leisure pattern good, whereas 42% saw it as bad.
Percent distribution of resident household members, by classification of per capita disposable income, with the 40% poorest and 10% richest in the population, by evaluation of quality of life in relation to leisure - Brazil - period 2017-2018
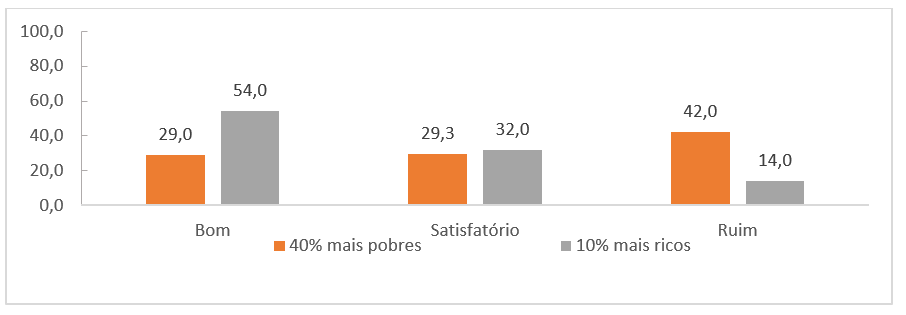
Source: IBGE, Diretoria de Pesquisas, Coordenação de Trabalho e Rendimento, Pesquisa de Orçamentos Familiares 2017-2018.


