POF 2017-2018
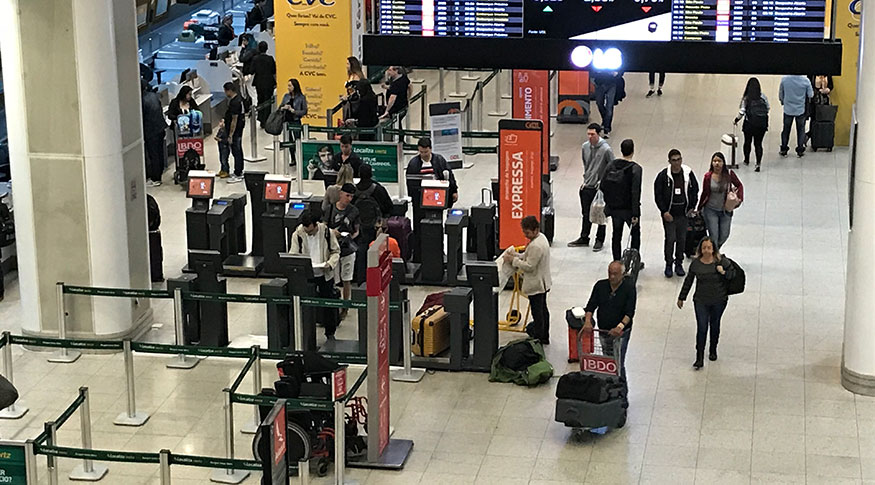
Households headed by white persons spend almost twice on travel and leisure than those headed by blacks or browns
August 19, 2021 10h00 AM | Last Updated: August 20, 2021 03h41 PM
Highlights
- Average monthly expenditure per person was R$ 53.93, with R$ 34.41 in households headed by white persons and R$ 18.35 in households headed by blacks or browns between 2017 and 2018.
- Expenditure also varied by sex and the level schooling and the income of the reference person.
- Travel represented 72.3% of the expenditure of households on leisure.
- 65.8% of persons lived in households that considered their leisure pattern good and, 34.1%, as bad.

Households headed by white persons spent almost twice on travel and leisure, between 2017 and 2018, than those whose householders were black or white. In the former group, average monthly expenditure per person amounted to R$ 34.41. In the caase of a black or brown householder that figure amounted to R$ 18.35. These data come from the IBGE's Consumer Expenditure Survey - POF 2017-2018: Profile of Expenditures.
This difference is even bigger depending on the type of leisure. In terms of travel, for example, investment in excursions and tourism packages is almost three time higher in households headed by white persons (R$ 7.68) than in those headed by blacks or browns (R$ 2.58). On the other hand, the difference considerimg cultural and sports events, or reading, toys and games is smaller.
Besides color or race, expenditure on travel and leisure varied according to the sex of the reference person. In families headed by women (R$ 18.12) monthly expenditure by person was half of that observed in the case of male householders (R$ 35.80).
Depending on the level of schooling and income, that difference is even bigger. In the 10% richest households, monthly expenditure on leasure and travel reached R$ 26.43 per person, whereas in the 10% with the lowest income, expenditure was of only R$ 0.84. Similar disparity can be seen in households whose reference person has a higher education degree (R$ 27.08) and against those headed by persons without schooling (R$ 1.07).
“What accounts for all these differences is inequality of income among households, which varies according to the level of schooling, formal or informal nature of work and household composition. In households with disposable income beyond essential expenses, expenditure on travel and leisure is the highest,” says the survey analyst Luciana Alves dos Santos.
Between 2017-2018, average per capita expenditure of all households on sporadic travel and leisure was R$ 53.93, with 72.4% of the total being spent on travel. The remaining 27.6% was spent on other activities such as reading, tickets for entertainment, sports and recreation events, besides toys and games.
From the total spent on travel, 73.4% were on food, transportation and lodging and 26.6% on excursions and events and national and international tourism packages. Among the other activities, 63.8% referred to cultural, sports and recreation events and 36.2% to reading, toys and games.
65.8% say they have good or satisfactory access to leisure and 34.1%, see it as bad
The survey also reported the subjective evaluation of interviewed persons about their pattern of leisure between 2017 and 2018. About 35.1% of the persons belonged to households that evaluated their living pattern as good iconsidering quality of public and private leisure services accessed by household members in the period. Another 30.7% considered that aspect as satisfactory, and 34.1%, as bad.
Among the 35.1% of persons in households that considered their leisure pattern good, 16.5% were members of households headed by white persons and 18.2% by black or brown persons. As for a bad pattern, though, the difference between the two segments was bigger: among the 34.1% who were part of households that saw their leisure pattern as bad, 12.1% were from households with a white reference person and 21.6%, with a black or brown reference person.
Among the 10% households with the highest income, 54.0% of the persons were in households that considered their leisure pattern as good and 14.0% as bad. On the other hand, among the 40% households with the lowest income, only 29.0% of the persons were members of households that considered their leisure pattern good, whereas 42% saw it as bad.


