PAIC 2017: Infrastructure works and public sector lose share in construction industry
May 29, 2019 10h00 AM | Last Updated: May 30, 2019 05h42 PM
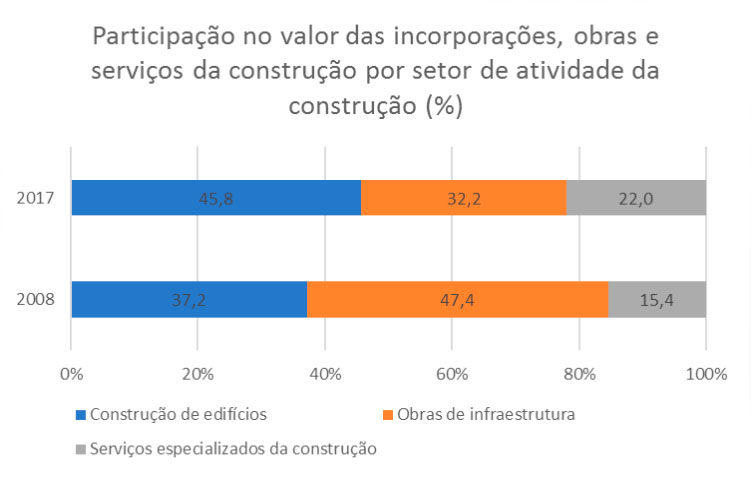
The activity of construction produced R$280 billion in the value of real estate development, works and construction services in 2017. The data of the Annual Survey of Construction Industry show a drop in the share of the infrastructure works in the value of the activity between 2008 and 2017 (from 47.4% to 32.2%), whereas the representativeness of building construction (from 37.2% to 45.8%) and expert services (from 15.4% to 22.0%) increased.
In addition, the public sector lost representativeness in the total construction industry, changing the generation of value of the works from 42.7% to 31.7% The biggest lost of share of the public sector was in the value of the infrastructure works, which changed from 60.3% in 2008 to 52.4% in 2017.
This sector comprised 126.3 thousand active enterprises, which employed about 1.91 million persons in 2017. The expenses with wages, withdrawals and other compensation reached R$ 53.5 billion. Between 2008 and 2017, the average number of persons employed in these enterprises fell from 32 to 15 persons, and the monthly average wage changed from 2.7 to 2.3 minimum wages.
All the segments posted a drop in the average number of employed persons. The segment that mostly lost share between 2008 and 2017 was that of infrastructure works, which had the biggest average size (from 93 to 42) and the highest average wage (from 3.5 to 2.9 minimum wages). Access the support material for more information.
Building construction gains share in construction industry
The three sector that comprise the construction industry produced R$280 billion in value of real estate development, works and construction services in 2017, being R$128.1 billion in building construction, R$90.3 billion in infrastructure works and R$61.6 billion in expert construction services.

The structure of the value of the activity changed in relation to 2008, in which building construction became the most representative segment, whereas infrastructure works fell to the second position. Expert services remained in the third position, yet they improved their share in the value of the construction industry.
In addition, the public sector lost representativeness as client of the construction industry in the period under analysis, losing 11 percentage points in the value of works and services, from 42.7% to 31.7%. The segment of infrastructure works, whose public share as client is historically higher than the others, was the most affected, dropping from 60.3% in 2008 to 52.4% in 2017. The demand for building construction from the public sector retreated from 27.2% to 20.7%. On the other hand, the expert construction services recorded a relatively smaller decrease, changing from 23.4% to 21.7%.
Average number of employed personnel and monthly average wage fall
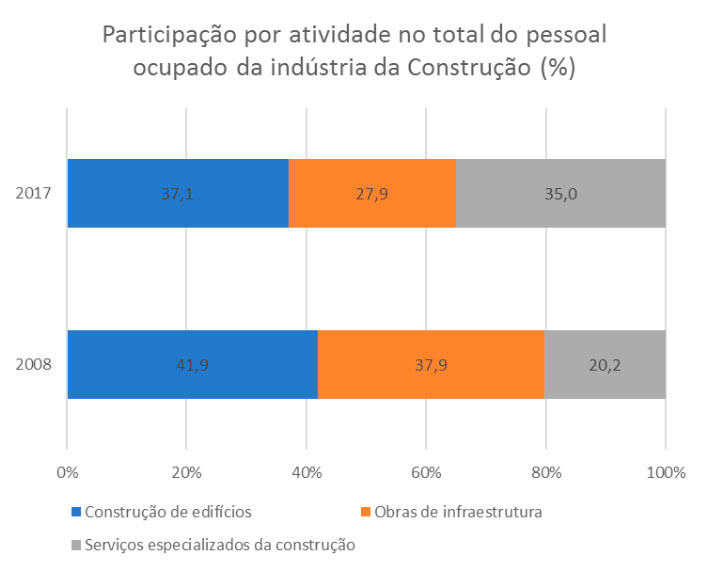
The construction enterprises employed about 1.91 million persons in 2017, being 37.1% in building construction; 35.0% in expert services; and 27.9% in infrastructure works.
In relation to 2008, infrastructure works lost share in terms of employed personnel and changed from the second to the third position, being surpassed by expert construction services. The segment of building construction remained as the major employer along the time series.

In addition, the average number of employed persons per enterprise dropped from 32 persons in 2008 to 15 in 2017. The monthly average wage changed from 2.7 to 2.3 minimum wages.
All the segments posted a drop in the average number of employed persons. The segment that mostly lost share between 2008 and 2017 was that of infrastructure works, which had the biggest average size (from 93 to 42) and the highest average wage (from 3.5 to 2.9 minimum wages). As a result, the profile of the employment in construction became frequently related to lower wages.
Expenses with personnel represent 33.8% of expenditures in construction industry
Both in 2008 and 2017, the main item of costs and expenditures of the construction activity was that related to expenses with personnel, which changed from 29.2% to 33.8%. The consumption of construction material fell from 26.6% to 22.0%. On their turn, works and/or services hired changed from 10.7% in 2008 to 9.1% in 2017.
Among the products and/or services provided by the enterprises with 30 and more employed persons, the three groups of products with the biggest share in real estate development, works and construction services were: residential works (24.3%); construction of roads, railways and urban works (18.8%); and expert services for construction (18.0%).
Participation of South Region in the construction industry was that mostly increased
Despite the Southeast Region loss of share between 2008 and 2017, it remained the leader in employed personnel and value of real estate development, works and/or construction services. On the other hand, the South Region registered the biggest gains of share, both in value and in employed personnel.
In terms of the generation of value of real estate development, works and construction services, the share of the Southeast changed from 55.5% to 49.8%. The North Region also lost share (from 7.9% to 5.6%), whereas the South (from 12.1% to 17.1%) and Northeast (from 15.8% to 18.9%) gained share. The Central-West Region maintained its share stable at 8.7%.
The regional distribution of the persons employed in the construction industry followed the pattern of the value of real estate development, works and construction services. Between 2008 and 2017, the Southeast (from 51.7% to 48.8%) and North (from 6.7% to 5.6%) lost share in employed personnel, whereas the Northeast (from 19.9% to 21.2%) and, mainly, the South (from 13.5% to 16.3%), gained share. The Central-West Region maintained stable its share in persons employed in the construction industry in this period.
In regional terms, the survey only takes into account enterprises with five and more employed persons.


