In June, IBGE forecasts 5.3% lower crops than in 2017


July 10, 2018 09h00 AM | Last Updated: July 11, 2018 04h29 PM
The sixth estimate of 2018 for the national crops of cereals, legumes and oilseeds totaled 227.9 million metric tons, 5.3% below that of 2017 (240.6 million tons), with decrease of 12.7 million tons.
| June estimate for 2018 | 227.9 million metric tons |
|---|---|
| 2018 / 2017 crop change | - 5.3% (-12.7 million metric tons) |
| June 2018 / May 2018 change | - 0.1% (- 230,143 metric tons) |
The area to be harvested is 61.2 million hectares, with a high of 31,009 hectares over the harvested area in 2017. In relation to May (228.1 million metric tons), production 0.1% (230,143 metric tons), with the area shrinking just 12,251 hectares.
Altogether, rice, corn and soybeans represented 92.8% of the produciton estimate and accounted for 87.0% of the area to be harvested. In relation to the previous year, there was increase of 2.6% in the soybean area and reductions of 7.3% in the corn area and of 4.2% in the rice area. Concerning production, there were decreased of 15.9% for corn, 7.2% for rice and increase of 1.2% for soybeans. The LSPA complete publication, time series and presentation are on the right of this page.
June estimate versus May 2018
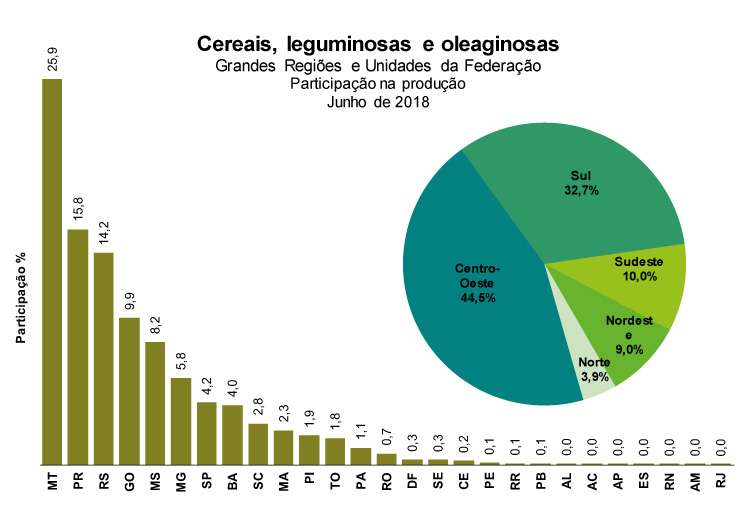
Among the Major Regions, production was distributed as follows: Central-West (101.1 million metric tons), South (74.8 million metric tons), Southeast (22.8 million metric tons), Northeast (20.6 million metric tons) and North (8.5 million metric tons).
In June, thehighlights in production estimates, in relation to May were: coffea canephora (3.2%), beans 1st crop (3.2%), tomatoes (2.9%), upland cotton (1.1%), corn 1st crop (1.1%), soybeans (0.5%), coffea arabica (-05), beans 3rd crop (-1.0%), sugarcane (1%), corn 2nd crop (-1.9%), banana (-2.0%) and beans 2nd crop (-2.6%).
UPLAND COTTONSEED – The estimated cotton production reached 4.7 million metric tons. In June, there was a 1.1% increase in the production estimate compared to May, and the average yield increased by 0.9%. Mato Grosso and Bahia should account for 90.0% of Brazilian production in 2018. The average yield in Bahia was revised up to 3.8% in relation to May, while the planted area and area to be harvested increased 1.1%. Bahia estimates it will harvest 1.1 million metric tons of cotton, up 5.0%. In Mato Grosso, the planted area reached 765.2 thousand hectares, up 24.1% over 2017. In Bahia, the planted area reached 267.2 thousand hectares, a high 1.1% in the same comparison.
BANANA – The Brazilian production, estimated at 6.8 million metric tons of the fruit, fell 2.0% in relation to May. Although the average yield was up 1.0%, the area to be harvested fell by 3.0%. Estimates of production in Bahia (802.0 thousand metric tons) decreased 12.1%, with the area being harvested shrinking 13.9% and the average yield increasing 2.1%.
COFFEE (bean) – The estimates of coffee production are of 3.4 million metric tons (57.3 million 60 kg sacks) increased by 0.4% over the previous month. The average yield increased by 1.4%. The current production estimate is a record in the IBGE time series. The estimated production of coffea arabica of 2.6 million metric tons (43.2 million 60 kg sacks), despite a 0.5% decline compared to the previous month, is also a record.
For coffea canephora or conillon, the production estimate is 848.3 thousand metric tons (14.1 million bags of 60 kg). In June, there was a 3.2% increase in the production estimate, with the average yield growing 5.0%. Espírito Santo, the largest Brazilian producer of conillon (64.9% of the total to be harvested by the country), increased its production estimate by 5.0% in relation to the previous month, reaching 550.7 thousand metric tons (9.2 million bags of 60 kg). The average yield of 2,119 kg/ha increased by 7.8%. In relation to 2017, the production estimate is 24.5% higher, with the average yield increased by 24.3%. The country must harvast its biggets conillon coffee crop.
SUGARCANE - The estimate for Brazilian production, of 691.4 million metric tons, rose 1.7% in relation to May, with a 1.3% fall in the area to be harvested. In São Paulo, the production estimate for 2018 fell by 2.8%, with the area to be harvested decreasing by 2.5% in relation to the previous month. In relation to 2017, the production estimate is higher by 0.5%. There were also increases of 1.7% and 1.3% in the planted area and in the area to be harvested, respectively, and a reduction of 0.8% in the average yield.
BEANS (grain) - Compared to May, there were reductions of 7,072 hectares (0.2%) in the estimate for the area planted with total beans and 0.6% in the average yield, with the production estimate increasing by 0.3%. In this survey, the largest producers, including the three crops, are Paraná (17.3%), Minas Gerais (16.9%) and São Paulo (11.0%). The bean 1st crop was estimated at 1.6 million metric tons, an increase of 3.2% over the May production estimate. The estimate for the average yield and for the area harvested also increased by 2.6% and 0.5%, respectively.
The estimate for the bean 2nd crop was 1.2 million metric tons, 2.6% lower than in May, following the average yield, which fell 1.1%. The area to be harvested fell by 1.5%. In relation to 2017, the production of bean 2nd crop had an increase of 3.2%. For the average yield an increase of 1.2% was estimated and, for the harvested area, an increase of 2.0%. This crop represents 36.1% of the total bean produced in the country.
Regarding bean 3rd crop, the estimate is for a reduction of 1.0% in production in relation to the previous month. Altogether, the country must produce 553.7 thousand metric tons in this season. São Paulo was the state with the greatest influence on this result, with a decrease of 4.2% in average yield and of 3.6% in production. In relation to 2017, the estimate for production increased by 1.8% and the average yield by 3.0%. This third crop represents 16.3% of all the beans produced in the country.
CORN (grain) - In relation to the previous month, the June production estimate is is 1.0% lower. After a record crop in 2017, the forecast for corn production in 2018 showed a reduction of 15.9%, with a total of 83.7 million metric tons. This reduction is due to the retraction of 7.3% in the planted area. Corn first crop is practically harvested. There was a 1.1% high in the production, due to the increase in the production estimate of Bahia (17.6% or 283.6 million metric tons). The cultivated area was 5.2 million hectares, 9.4% below that of 2017. Production was estimated at 26.0 million metric tons, with an average yield of 5.074 kg/ha, which were respectively 16.4% and 9% lower, than in 2017. The production of the 2nd crop is estimated at 57.7 million metric tons, planted on 11.4 million hectares. On average, there was a drop of 1.9% in production, with an average growth of 1.7%. In relation to 2017, the estimated planted area and production fell by 7.6% and 15.7%, and the average yield dropped to 5,060 kg/ha (-9.3%).
SOYBEAN (grain) – The Brazilian soybean production of 116.3 million metric tons increased 0.5% in relation to the previous month, registering another record in the time series. In June, Bahia production was upgraded (+ 9.5% or 484.0 thousand more metric tons), with the average yield increasing by the same percentage. In São Paulo, production was also revised up by 2.8%. In relation to 2017, the Brazilian soybean production grew 1.2%, despite the average yield having shrank by 1.4%. The area planted and the area to be harvested grew by 2.6%, reaching 34.8 million hectares.
TOMATO – The Brazilian tomato production is expected to reach 4.5 million metric tons, an increase of 2.9% over the previous month. The planted area and the area to be harvested, of 66.2 thousand hectares, show an increase of 4.4%, while the average yield, a decline of 1.5%. In relation to 2017, tomato production presented growth of 3.5%, reflecting the increases of 2.4% in the area to be harvested and of 1.1% in the average yield.
June estimate versus 2017
Among the 26 products surveyed, 18 have a positive change in production compared to 2017.
| Production and Annual Change by Product | |||
|---|---|---|---|
| Product | Production 2017 (t) | Production 2018 (t) | Change (%) |
| Upland cottonseed | 3,838,785 | 4,720,332 | 23.0 |
| Peanut (1st crop) | 531,280 | 542,118 | 2.0 |
| Peanut (2nd crop) | 9,898 | 11,282 | 14.0 |
| Rice | 12,452,662 | 11,558,109 | -7.2 |
| Oat | 609,130 | 753,729 | 23.7 |
| Potato (1st crop) | 1,968,761 | 1,787,497 | -9.2 |
| Potato (2nd crop) | 1,233,004 | 1,232,479 | 0.0 |
| Potato (3rd crop) | 1,078,032 | 790,370 | -26.7 |
| Cocoa | 214,348 | 232,747 | 8.6 |
| Coffea arabica | 2,095,275 | 2,589,425 | 23.6 |
| Coffea canephora | 681,346 | 848,348 | 24.5 |
| Sugarcane | 687,809,933 | 691,436,412 | 0.5 |
| Onion | 1,719,412 | 1,660,210 | -3.4 |
| Barley | 286,405 | 427,397 | 49.2 |
| Bean (1st crop) | 1,561,956 | 1,610,978 | 3.1 |
| Bean (2nd crop) | 1,185,542 | 1,223,863 | 3.2 |
| Bean (3rd crop) | 543,814 | 553,717 | 1.8 |
| Orange | 18,666,928 | 17,100,491 | -8.4 |
| Castor beans | 11,834 | 24,629 | 108.1 |
| Cassava | 20,606,037 | 20,704,182 | 0.5 |
| Corn (1st crop) | 31,064,540 | 25,977,030 | -16.4 |
| Corn (2nd crop) | 68,481,488 | 57,736,865 | -15.7 |
| Soybean | 114,982,993 | 116,309,308 | 1.2 |
| Sorghum | 2,147,706 | 2,395,821 | 11.6 |
| Wheat | 4,241,602 | 5,668,546 | 33.6 |
| Triticale | 41,940 | 45,949 | 9.6 |
The Systematic Survey of Agricultural Production - LSPA is a monthly survey to forecast and monitor the harvest of the main agricultural products, whose information is obtained by means of the Municipal Commissions - COMEAs and/or Regional Commissions - COREAs. The latter are consolidated at state level by the Agriculture Statistics Coordinating Groups - GCEAs and, later, evaluated at national level, by the Special Commission of Planning, Control and Evaluation of Agricultural Statistics - CEPAGRO. This Commission is formed by representatives from the IBGE and from the Ministry of Agriculture, Livestock and Supply - MAPA.
Due to users’ needs of harvest data, the surveys relative to Cereals (rice, corn, oat, rye, barley, sorghum, wheat and triticale), Legumes (peanuts and beans) and Oilseeds (cotton seed, castor beans, soybeans and sunflower) have been conducted in close partnership with the National Supply Agency of the Ministry of Agriculture (CONAB), a subdivision of the Ministry of Agriculture, Livestock and Supply (MAPA). That initiative is the result of a process (started in March, 2007) of harmonization of official harvest estimates for the main Brazilian crops.
