Environmental-Economic Accounting
In 2020, Brazil consumes 6.2 liters of water for each R$1 generated by the Economy
June 02, 2023 10h00 AM | Last Updated: June 16, 2023 06h56 PM
Highlights
- In 2020, 6.2 liters of water were used for every R$1 in the gross added value of the Brazil's economy.
- In the same year, the current gross value added (GVA) of the economic activity Water and sewage totaled R$ 48.2 billion.
- The value of the production of natural water and sewerage services was R$ 74.5 billion. The participation of natural water in this total was 65.7%.
- In Agriculture, livestock, forestry, fishing and aquaculture, the average cost of water used was R$ 0.11/m³, taking into account the public irrigation perimeters (PPI).
- Additions to the total supply of water in the country amounted to 24.9 million cubic hectometers (each cubic hectometer equals 1 million cubic meters). Precipitation (rainwater) was the main form of addition, responsible for 56.2% of the total.
- The reduction in the water supply in 2020 was 25.9 million hm³ and the largest share in this total was the water outflow (46.8%) either to the sea, to other countries or to other resources within the territory.

In 2020, 6.2 liters of water were consumed for each real of gross value added (GVA) generated by the Brazilian economy. This is one piece of information from the survey released today (2): Environmental-Economic Accounting for Water (2018-2020), a study carried out by IBGE in partnership with the National Water Agency (ANA) that provides information on hydrological resources and water's contribution to economic activities and households.
"Water is very important for the economy, as it is used by all economic activities, either in production or for human consumption" says Michel Lapip, manager of Environmental-Economic Accounting.
In the scope of the water use intensity indicator, which presents the flow rate of water consumed (in liters) to generate each real of GVA, the highlight is Agriculture, Forestry, Fishing and aquaculture among the economic activities analyzed in the publication. This sector needed 683.8 liters of water to generate each real of GVA in 2020. Compared to the previous year, there was a decrease of 27.2%. During this period, while the water consumption of this activity increased by 1.8%, the GVA increased by 39.9%. When soil water consumption (resulting from rains) is removed, the activity consumed 78.4 liters for every R$ 1 generated in 2020.
The study has also estimated the indicator of activities based on the total use of water (the total volume of water that comes via water supply system or the one abstracted directly from the environment) instead of just considering consumption, when the volume of water discharged back into the environment is excluded. In this case, there was greater water use intensity by hydroelectric power plants of the Electricity and gas activity, due to the water volume necessary to move the sector’s turbines.
In 2020, the current gross value added (GVA) of the Water and sewage economic activity was R$ 48.2 billion. This value refers to the activity's contribution to the Gross Domestic Product (GDP) and corresponded to 0.7% of the current gross value added of the country's economy. The production values of natural water and sewerage services, which also include the supply of water for irrigation, were calculated in the Water and sewage activity.
In the Southeast and South, the activity Water and sewage corresponded to around 0.8% of the current GVA, followed by the Central-West (0.7%), Northeast (0.6%) and North Regions (0.3%).
Production value of natural water and sewerage services in the country is R$ 74.5 billion
The production value of natural water and sewerage services was estimated at R$ 74.5 billion in 2020. Among the components of this activity, natural water stands out, accounting for 65.7% of this total. On the demand side, households were the major responsible for both the expenses with the use of natural water (59.4%) and the expenses with sewerage services (59.8%).
The survey also related intermediate consumption with natural water to the water flow rates received from the Water and Sewage activity and calculated their average cost. In Agriculture, forestry, fishing and aquaculture, this average cost was R$ 0.11 per cubic meter (m³). In the sector, the volume of water that comes from the supply system is mainly related to the public irrigation perimeters (PPI), which are intended for agricultural exploitation.
Excluding the Water and sewage activity, the average cost of water and sewage for all economic activities was R$5.75/m³. The average cost for households was R$ 3.59/m³. The average cost per volume of water and sewage for the total economy was R$ 4.09/m³ in 2020. In 2018, this value had been R$ 3.50. The Central-West recorded the highest values in 2020 (R$ 5.29 for every thousand liters).
Between 2018 and 2020, there was an average growth of 1.9% in the volume of water abstraction for water collection, treatment and distribution, a percentage that is considered relatively stable. Households, as final users, were responsible for 70.5% of this volume. During this period, while households increased their total use of water supply by 1.6%, the use of water in economic activities decreased by an average of 3.2%. In 2020 alone, the first year of the Covid-19 pandemic in the country, there was a drop of 11.3% compared to the previous year in relation to economic activities.
“In 2020, circulation restrictions were established as preventing measures to the pandemic in several cities and families stayed at home. In addition, many economic activities retracted and, consequently, reduced water use”, explains Mr. Lapip.
Additions to the country's water stock totaled 24.9 million hm³ in 2020
The additions to the country's water supply totaled 24.9 million cubic hectometers (hm³ - each hectometer corresponds to 1 million cubic meters). The stock is the entire volume of water available or stored in surfaces (in rivers, streams, lakes and artificial reservoirs), in aquifers (groundwater) and in the soil. Additions can come from rainfall, from the inflow of water from rivers with sources outside Brazil and from the return of water used in economic activities. The participations in additions to the stock were: precipitation (rainwater) (56.2%), inflows (28.5%) and discharge back into the environment by economic activities (15.3%).
The reduction in the stock was approximately 25.9 million hm³ and the main factors were the outflow of water to the sea, to other countries or to other resources within the territory (46.8%), evaporation/evapotranspiration of plants (37.4%) and water collection by economic activities (15.8%).
Between 2018 and 2020, the precipitation volume had a cumulative decrease of 9.1%. From the total addition to the stock of surface waters (12.09 million hm³) in the country 2020, 3.58 million of hm³ corresponded to the return to artificial reservoires, rivers, streams and lakes by economic activities. This addition represents nearly 30% of the total. Precipitation, in turn, was 1.42 million hm³, whereas other 2.43 million hm³ come from other countries.
The reduction in stocks of surface waters in the country was 16.64 million hm³ in 2020. Out of this total, water abstraction for the economy responded for 3.58 million hm³ and the outflow to other countries (downstream) was of 0.50 million hm³.
Electricity sector stands out in total water withdrawal
The total water withdrawal in the country in 2020 was nearly 4.1 million hm³. This number comprises both abstraction for own use and abstraction for distribution. The Electricity and gas sector was the one that most contributed to this total volume.
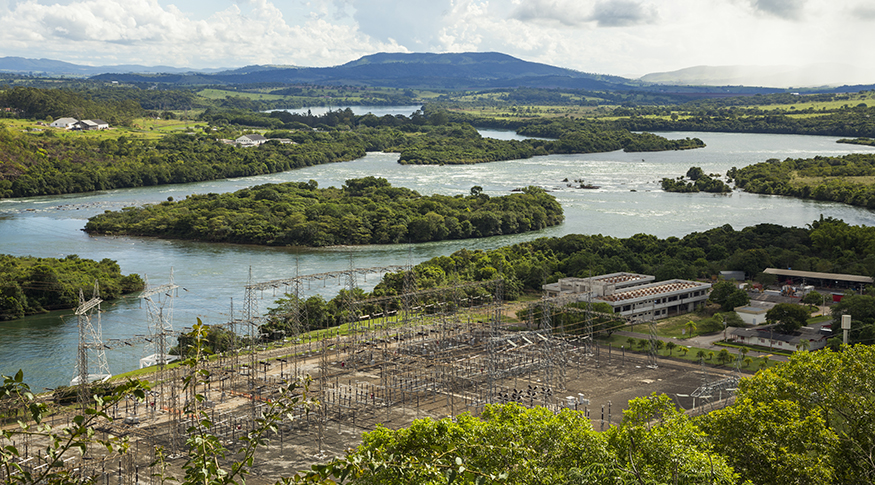
In 2020, the participation of this activity in the total withdrawal was 85.1%. “In Brazil, hydroelectric energy predominates in the energy matrix. In this activity, there is no consumption of water; there is the removal of the river bed or the dam, the passage through the turbines, the transformation into energy and the return of water in the same quantity and quality. This is what characterizes non-consumptive use. In the beverage industry, however, the abstracted water does not return in its entirety, there is consumption”, explains the researcher.
The withdrawal in the Sewerage activity and related activities refers to the collection of rainwater drained by the rainwater networks. In 2020, this volume corresponded to 0.9% of the total water withdrawal.
The main direct water abstractions, considering only consumptive use (when part of the volume consumed does not return to the environment) were made by: Agriculture, livestock, forestry, fishing and aquaculture (95.2%) and Water collection, treatment and distribution (3.5%).
The survey also analyzed the total water withdrawal by economic activities considering the type of water body. In Agriculture, livestock, forestry, fishing and aquaculture, 92.4% of the withdrawn volume was from water stored in the soil, used by rainfed agriculture, that is, non-irrigated.
Agriculture accounts for more than half of water abstractions for consumptive use
Surface water and groundwater abstractions by economic activities for consumptive use totaled 71.2 thousand hm³. The activity with the greatest participation in this withdrawal was Agriculture, livestock, forestry, fishing and aquaculture (58.2%), followed by Water collection, treatment and distribution (27.9%) and by Manufacture and construction industries ( 8.4%).
Another point observed by the survey was the origin of the water used by economic activities and by households. In this indicator, water can come from abstraction for own use or from water collection, treatment and distribution service, such as companies that operate supply services or supply water used in public irrigation perimeters (PPI).
When considering the volume of water distributed for economic activities, the share of PPIs was 41.7%. Water collection, treatment and supply had less participation in economic activities than abstraction for own use.
Total consumption, which is water used minus the volume returned to the environment, was 306.1 thousand hm³ in 2020. Agriculture, livestock, foresty, fishing and aquaculture accounted for 97.1% of this total, with a highlight to rainfed agriculture. The manufacturing and construction industry (1.0%) and water and sewage (1.0%) also had a share in total consumption.
The return of water to the environment totaled 3.8 million hm³ in 2020. This return can come from the Water and sewage activity, from direct discharge by economic activities and from households. The survey calculated this return to the environment, excluding the non-consumptive use of the Electricity and gas activity, the rainwater that passes through the rainwater networks and the Agriculture, livestock, foresty, fishing and aquaculture activity. The total in this indicator was 23.2 thousand hm³ and 29.3% of this volume returned through the sewerage systems.
North Region was responsible for 87.1% of the water supply in the country
The North was the Major Region that most contributed to the inflow of water into the country's stock, with 87.1% of participation, due to the inflow of water from countries upstream in the Amazon Basin. This region was also the main responsible for water outflow, with an 80.0% share, followed by the Central-West (9.3%) and South (4.2%).
More about the survey
The publication Environmental-Economic Accounting for Water: 2018 to 2020, carried out in partnership with the National Water Agency (ANA), brings physical and monetary indicators on the supply and demand for water in Brazil. The data comprises economic activities and households. On Sidra database, it is possible to access information for Brazil and Major Regions.


