Fuels and food products have an impact on October inflation preview


October 23, 2018 09h00 AM | Last Updated: October 23, 2018 12h58 PM
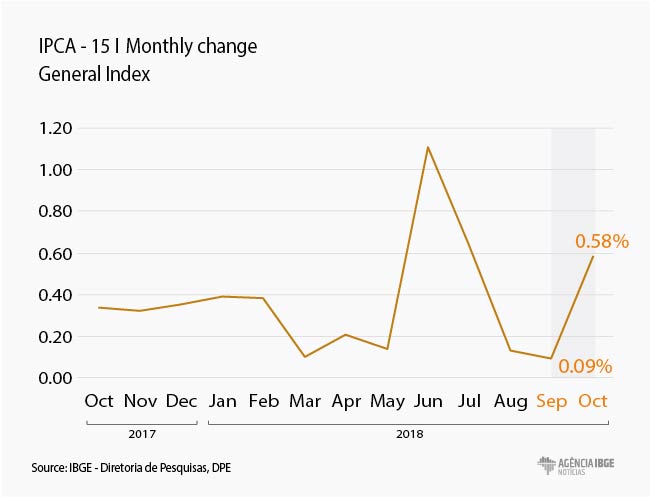
The inflation preview (IPCA-15), released today by the IBGE, rose from 0.09% in September to 0.58% in October. The groups Transportation (1.65%) and food products (0.44%) accounted for the acceleration of the IPCA-15, and accounted for about 70% of the monthly index. The cumulative index reached 3.83% in the year, and 4.53% in the month.
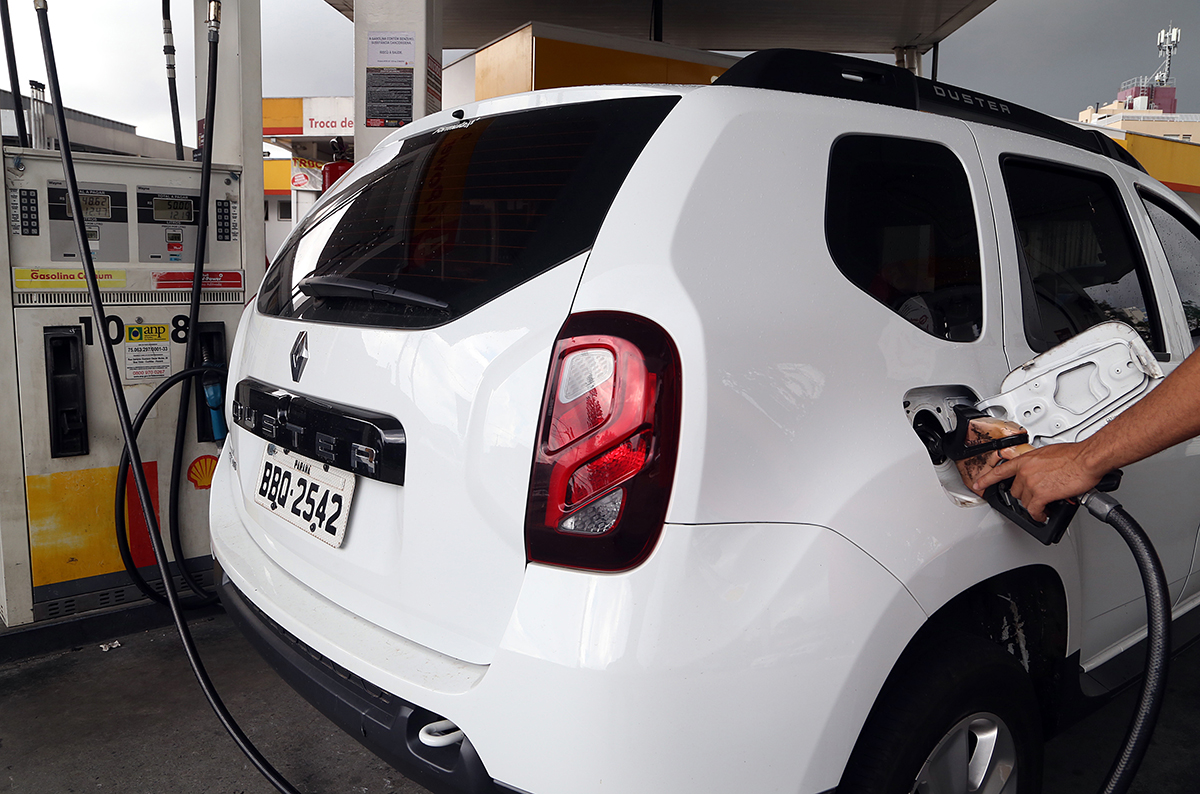
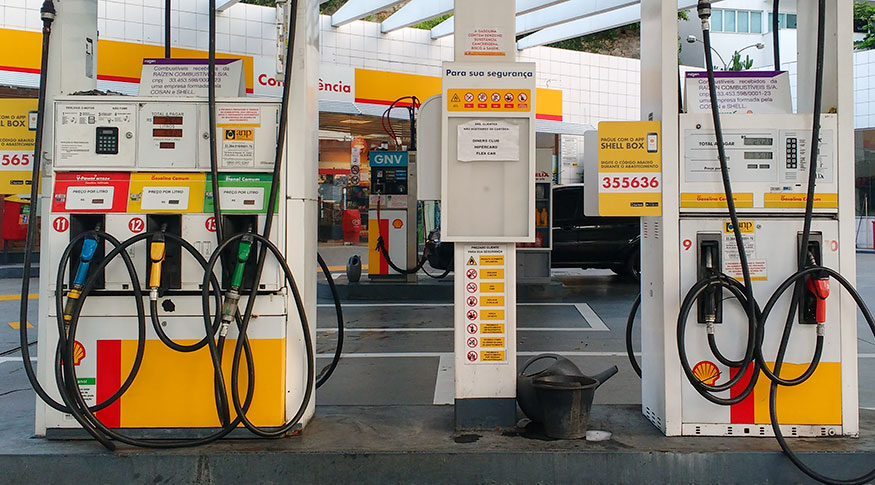
The group transportation recorded the biggest change in prices in October (1.65%), due to the rise of fuels, which changed from a decrease of 0.19% in September to an increase of 4.74% in October.
The liter of gasoline, which had fallen 0.07%, was 4.57% more expensive in the month. Ethanol had also recorded a decrease in September (-1.36%) and a hike in October, having risen by 6.02%. Diesel, in turn, had recorded an increase in September (2.41%) and remained on an upward trend in October, when it reached 5.71%.
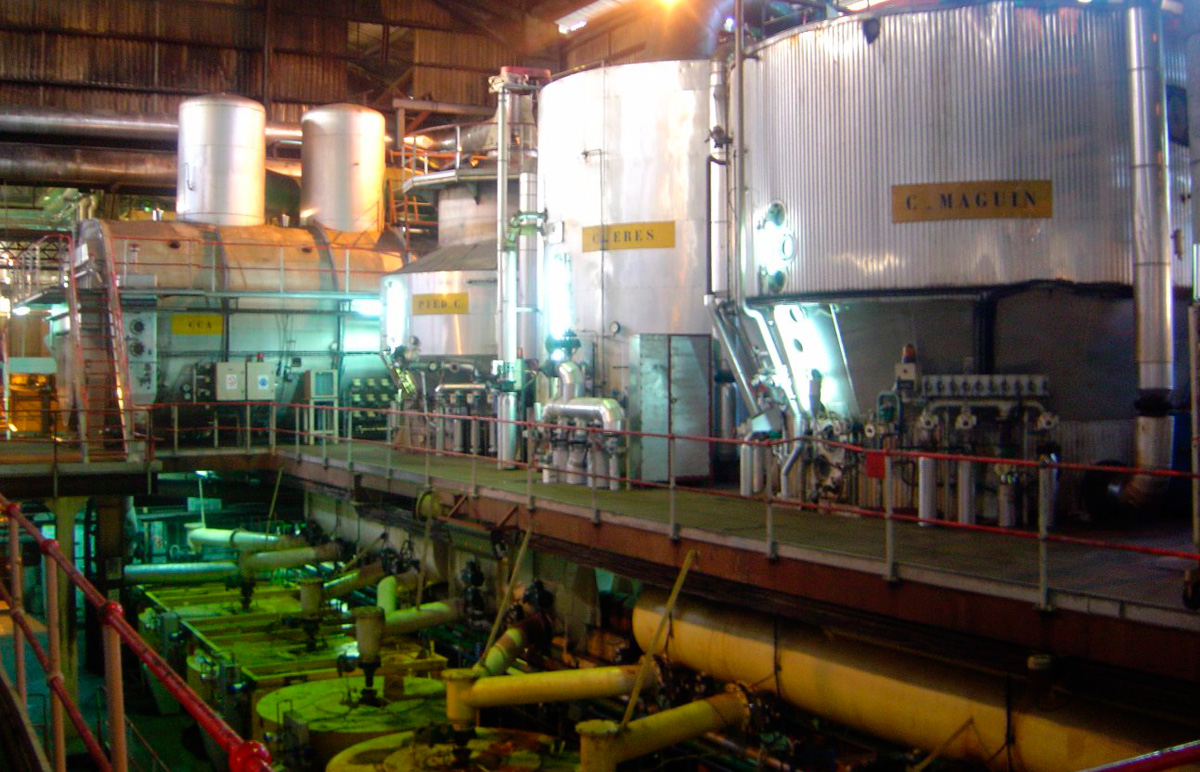
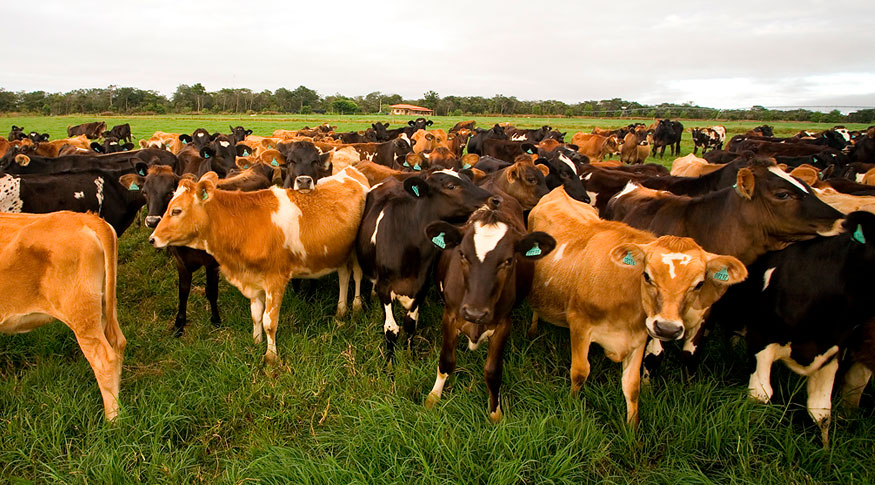
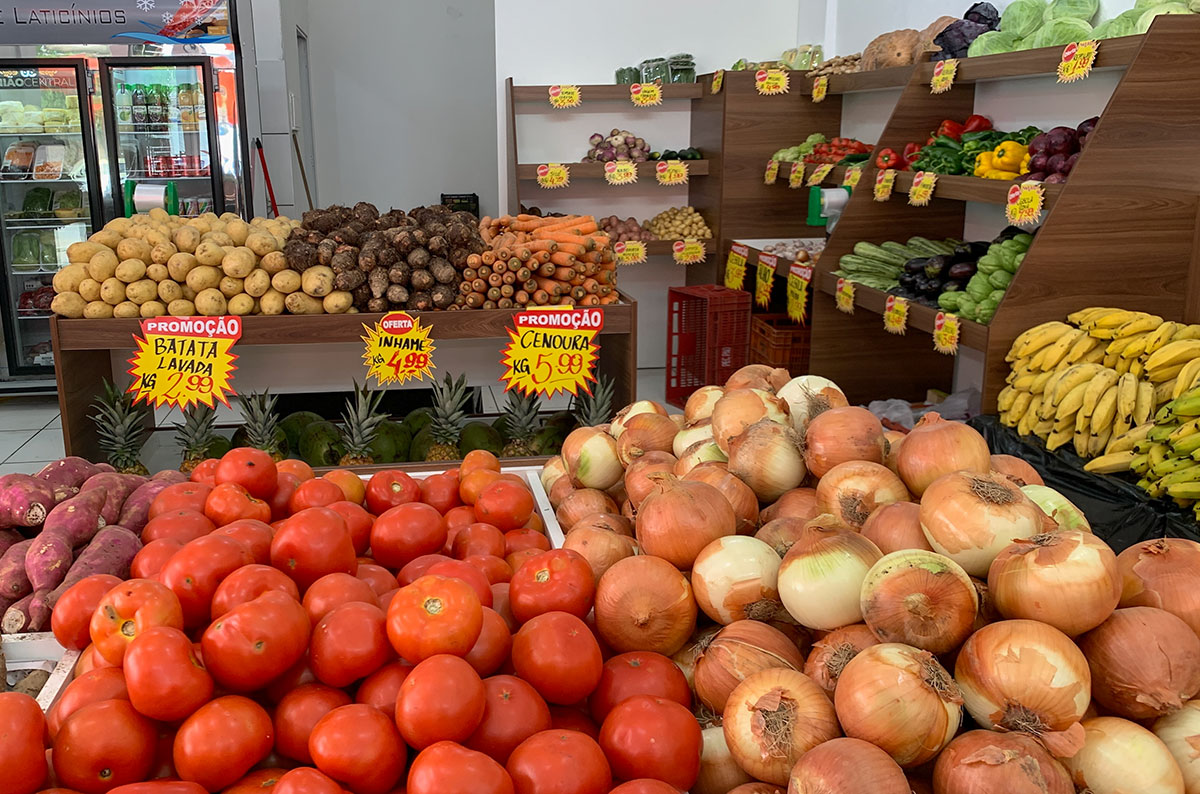
Similarly to fuels, food products had also faced a decrease in September (-0,41%) and decreased in October (0.44%). The prices of food products consumed at home rose, on average, 0.52%, due to items such as tomato, which was 16.76% more expensive, fruit (1.90%) and meat (0.98%). Snacks (0.74%) and meals away from home (0.26%) also got more expensive in October.
Porto Alegre records biggest increase in terms of areas
The price acceleration from September to October was widspread, and occurred in all the 11 areas surveyed. The metropolitan area of Pernambuco (0.35%) recorded the lowest result, due to the decrease of 2.33% in electricity. The highest figure came from the metropolitan area of Porto Alegre (0,91%), mainly due to the performance of gasoline (4.50%).
For the calculation of the IPCA-15, prices were collected in the period from September 14 to October 11, 2018 (reference) and compared with those in force from August 14 to September 13, 2018 (base). The indicator refers to families with income from 1 to 40 minimum wages and covers the Metropolitan Areas of Rio de Janeiro, Porto Alegre, Belo Horizonte, Recife, São Paulo, Belém, Fortaleza, Salvador and Curitiba, as well as Brasília and Goiânia. The methodology employed is the same as in the IPCA; the difference between them lies in the period of price collection and of geographic coverage.