
In the analysis of the percentage of persons who consumed any amount of food reported in 24 hours before the interview, the highest frequencies of food consumption were coffee (78.1%), rice (76.1%) and beans (60.0%).
The food that registered the highest averages of per capita daily consumption were coffee (163.2 g/day), beans (142.2 g/day), rice (131.4 g/day), juices (124.5 g/day) and soft drinks (67.1 g/day).
Between 2008-2009 and 2017-2018, the frequency of beans consumption fell from 72.8% to 60.0% and of rice consumption, from 84.0% to 76.1%, whereas that of raw vegetables changed from 16.0% to 21.4%. The drop in the rice consumption was noticed in the Southeast, South and Central-West and was steeper in the highest income quarter.
Except for acai and potatoes, the frequency of fruits, vegetables and legumes consumption was lower among teenagers than among adults and elderly persons. Teenagers consumed the double of sandwiches, four times more pizza, nine times more dairy drinks and 20 times more snacks than elderly persons.
The frequency of meat consumption decreased for teenagers, adults and elderly persons, at the same time that the frequency of poultry and swine consumption increased in these age groups.
The frequency of cassava flour consumption in the North was twice that in the Northeast and ten times higher than in the other regions. The per capita daily average consumption of soft drinks in the South was twice bigger than in the North and Northeast. The percentage of wine consumption away from home in the North was five times higher than in the South.
Both the frequency of consumption and the per capita average daily consumption of rice, green/corda beans, bean preparations, corn and corn preparations, French roll, fresh fish and cassava flour were higher for the lowest income quarters, with a sharp difference between the first and last income quarters.
Most of the amount consumed of beer (51.0% of the overall consumption) was away from home. A high percentage of amount consumed away from home, in relation to the overall consumption, was also noticed for hard liquors (44.1%) and fried and baked snacks (40.1%). The frequency of consumption of beer was of 3.5% among adults. Fried and baked snacks had a frequency of 12.1% among teenagers.
More than half (53.4%) of the calories consumed came from raw or minimally processed food, 15.6% from processed culinary ingredients, 11.3% from processed food and 19.7% from highly-processed food.
Highly-processed food provided, on average, nearly 27% of the total daily calories of teenagers, whereas it provided 15.1% for the population aged 60 years and over.
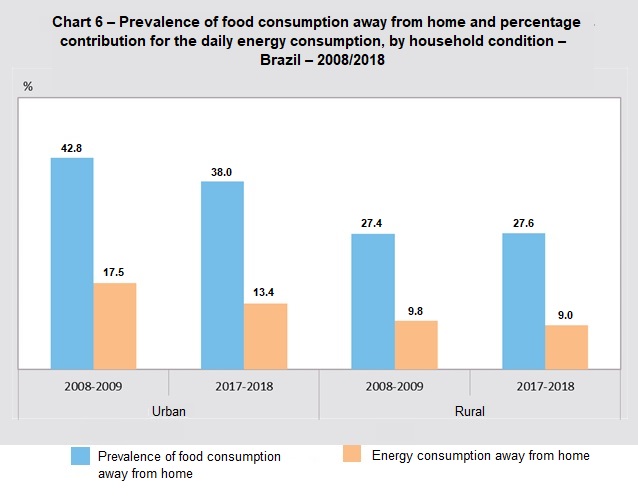
The frequency of food consumption away from home in Brazil dropped between 2008-2009 and 2017-2018, changing from 40.2% to 36.5% of the population. And the highest percentage contribution to the energy consumption was noticed in the Central-West Region, with 16.0%.
The addition of salt to ready-cooked preparations was reported by 13.5% of the population and it was more frequent among adult men (16.5%). The addition of sugar was reported by 85.4% of the population and elderly women were the group with the lowest proportion (69.2%).
The sodium intake above the acceptable limit was reported by 53.5% of the population. Between 2008-2009 and 2017-2018, the share of proteins, carbohydrates and fats in the energy intake of the population slightly changed. Nevertheless, the share of saturated fat in such intake retreated, probably due to the reduction in meat consumption.
This information is part of the Consumer Expenditure Survey 2017-2018: Analysis of the Personal Food Consumption in Brazil, which brings data on individual food intake of persons aged 10 years and over, by sex, age, monthly household income, urban or rural condition and Major Regions.
The survey was carried out through a covenant with the Ministry of Health.
Coffey, rice and beans are the most frequent food in the diet of Brazilians
The analysis of the frequency of food consumption – percentage of persons who consumed any amount of the food reported, in the 24 hours before the implementation of questionnaire – pointed out that the highest frequencies were of coffee (78.1%), rice (76.1%) and beans (60.0%), followed by French roll (50.9%) and oils and fats (46.8%).
In the division by sex, men recorded lower frequencies of consumption for all vegetables, legumes and fruits (except potatoes) and women posted higher frequencies of consumption for cookies, cakes, candies, milk and derivatives, coffee and tea.
Men consume, on average, three times more beer than women
The food that registered the highest averages of per capita daily consumption were coffee (163.2 g/day), beans (142.2 g/day), rice (131.4 g/day), juices (124.5 g/day) and soft drinks (67.1 g/day). Women recorded higher averages for most vegetables and fruits, whereas men posted higher estimates for nearly all the other food.
The per capita daily average of consumption of beer among men is more than the triple of the female average (54.5 g/day against 16.4 g/day).
More than half of the amount consumed of beer is away from home
Most of the consumption of beer is purchased and consumed away from home (51.0%). A high percentage of amount consumed away from home, in relation to the overall consumption, was also registered by hard liquors (44.1%), fried and baked snacks (40.1%), other non-alcoholic beverages (40.1%), ice cream/popsicle (37.2%), chips (32.7%), stuffed cakes (32.6%) and soft drinks (31.1%).
For most food, men recorded a higher percentage of amount consumed away from home in relation to the overall consumption. The major differences were found in the group of other non-alcoholic beverages, in which the consumption away from home of men was twice that of women.
Rural area consumes two times more fish, cassava flour and mortadella.
For most food, the frequencies of food consumption were higher in the urban area than in the rural area. On the other hand, the frequencies of consumption of green/corda beans, mangoes, cassava flour, fresh fish, other types of meat and mortadella in the rural area were twice that reported in the urban area.
In the urban area, the food with the highest frequency of consumption away from home were: beer (50.1%), fried and baked snacks (40.6%), other non-alcoholic beverages (40.4%), hard liquors (39.1%), ice cream/popsicle (37.8%), stuffed cakes (31.7%) and chips (31.5%).
In the rural area, the food with the highest proportion of consumption away from home were hard liquors (72.8%), beer (63.8%), stuffed cakes (42.9%), chips (42.9%), other non-alcoholic beverages (38.8%), fried and baked snacks (34.4%) and ice cream/popsicle (31.3%). The percentage of consumption away from home of soft drinks was the same for the urban and rural areas (31.1%).
Frequency of consumption of cassava flour in the North is twice that in the Northeast
Among the major regional differences in the frequency of consumption, cassava flour (40.6% in the North Region, 20.1% in the Northeast and 4%, at maximum, in the South, Southeast and Central-West), acai (12.4% of the population in the North and nearly 1% in the other regions) and fresh fish (16.6% in the North, 8.2% in the Northeast and less than 4% in the other regions) stood out.
The consumption of corn and corn preparations was reported by 25.8% of the population, whereas the consumption varied between 6.2% and 8.6% in the other regions. The consumption of beans was more frequent in the Central-West (72.8%), against 44.1% (North) and 64.9% (Southeast).
Daily per capita consumption of soft drinks in the South is twice that of the North and Northeast
The Central-West registered the biggest average per capita consumption of rice, beans, beef and whole milk. The South and Southeast concentrated the highest average per capita consumption for most fruits and vegetables, whereas the Northeast stood out for higher per capita averages of corn and corn preparations, and green/corda beans.
Compared with the other regions, the North Region recorded higher averages for the consumption of acai, cassava flour, fresh fish and milk preparations. The consumption of soft drinks was higher in the South, being twice the consumption estimated for the North and Northeast Regions. The South Region also stood out for high per capita consumption averages of pasta, noodles and noodle preparations, coffee and tea.
Frequency of consumption of fruits, vegetables and legumes is smaller among teenagers, except for acai and potatoes
Except for acai and potatoes, the frequency of consumption by age group showed that the percentage of teenagers who reported the consumption of fruits, vegetables and legumes was smaller in relation to that of adults and elderly persons.
In contrast, the consumption of instant noodles, stuffed cookies, sweet cookies, chips, sausage, weenies, mortadella, ham, chocolate, chocolate milk, ice cream/popsicle, juices, processed juices, soft drinks, dairy beverages, pizza, fried and baked snacks and sandwiches was higher among teenagers than among adults and elderly persons. In addition, the consumption of milk, coffee, tea and soups and broths was more frequent among elderly persons than among adults and teenagers.
Teenagers consume nine times more dairy beverages and 20 times more snacks than elderly persons
The per capita average consumption of most fruits, vegetables and legumes was smaller among teenagers than among adults and elderly persons, as well as that of skimmed milk, whole-grain bread, coffee, tea and soups and broths.
Conversely, the per capita consumption was higher among teenagers for low nutritional quality items, highlighted by: (a) stuffed cookies, whose average consumption was nearly four times higher among teenagers (9.7 g/day) than among adults (2.5 g/day) and 16 times higher than among elderly persons (0.6 g/day); (b) soft drinks, whose average consumption was 3.7 times higher among teenagers than among elderly persons; (c) dairy beverages, whose per capita average consumption in teenagers was 4 times than that noticed in adults and nearly 9 times higher than that estimated for elderly persons; (d) chips, whose average consumption among teenagers was 4 times higher than that of adults and 20 times higher than that estimated for elderly persons; (e) sandwiches, whose average consumption by teenagers was twice that noticed for elderly persons; and (f) pizza, who average consumption estimated for teenagers was 4 times that for elderly persons.
Brazilians with lower income consume more rice, beans, corn, acai and flour
Both the frequency of consumption and the daily per capita average consumption of rice, green/corda beans, bean preparations, corn and corn preparations, French roll, fresh fish and cassava flour were higher for the lowest income quarters, compared with those of higher income, with a sharp difference between the first and the last income quarters. The frequency of coffee decreased with the increase of the income level, though the average consumption increased up to the third quarter, with a reduction in the last stratum.
For most fruits, vegetables and legumes, the frequencies of consumption and the per capita values of consumption with the income classes increased, reaching differences of up to eight times higher between the last quarter and the first quarter for the frequency of consumption of pineapples and papaya, and up to ten times higher for the average consumption of cucumber and pineapples.
The per capita consumption of negative items of diet quality, like candies, pizza, fried and baked snacks and sandwiches was also higher in the highest income bracket. In addition, the per capita consumption of rice, beans, and corn and corn preparations was higher in the lowest income category and that of acai, cassava flour, salted meat and mortadella was three times higher in the first quarter than in the highest income quarter.
| Table 6 - Frequency of food consumption, average per capita food consumption and percentage of consumption away from home, by total income quarter and monthly per capita household asset variation of food and preparations - Brazil - 2017-2018 period (1) | ||||||||
|---|---|---|---|---|---|---|---|---|
| Food and Preparations | Frequency of food consumption (%) | Average per capita food consumption (g/day) | ||||||
| 1st quarter | 2nd quarter | 3rd quarter | 4th quarter | 1st quarter | 2nd quarter | 3rd quarter | 4th quarter | |
| Rice | 81.2 | 78.8 | 74.8 | 67.1 | 154.0 | 138.6 | 124.2 | 99.0 |
| Corn and corn preparations | 17.0 | 11.7 | 9.7 | 7.7 | 24.3 | 17.4 | 12.7 | 9.2 |
| Beans | 60.7 | 64.3 | 61.7 | 51.8 | 154.4 | 159.4 | 143.7 | 102.4 |
| Green/corda beans | 7.8 | 3.9 | 2.0 | 1.4 | 18.6 | 8.0 | 3.4 | 2.3 |
| Bean preparations | 13.8 | 11.3 | 11.2 | 11.2 | 34.7 | 27.8 | 24.6 | 24.1 |
| Raw salad | 14.7 | 21.4 | 24.0 | 29.8 | 14.3 | 19.4 | 22.7 | 29.0 |
| Cucumber | 0.5 | 0.9 | 1.6 | 2.7 | 0.2 | 0.4 | 1.1 | 2.0 |
| Tomatoes | 2.8 | 4.5 | 6.1 | 7.8 | 2.4 | 3.4 | 5.0 | 6.7 |
| Other legumes | 3.9 | 7.8 | 10.7 | 13.3 | 3.6 | 6.3 | 8.9 | 9.7 |
| Sweet potatoes | 1.7 | 2.3 | 2.9 | 2.9 | 5.2 | 6.7 | 7.7 | 7.1 |
| Potatoes | 5.0 | 7.0 | 8.9 | 13.0 | 6.5 | 8.4 | 12.7 | 17.0 |
| Pineapple | 0.2 | 0.4 | 0.6 | 1.6 | 0.3 | 0.7 | 1.0 | 3.0 |
| Acai | 2.4 | 1.3 | 1.0 | 0.9 | 8.7 | 4.1 | 3.3 | 2.3 |
| Papaya | 0.9 | 1.7 | 3.4 | 7.5 | 1.9 | 3.4 | 7.0 | 14.6 |
| Cassava flour | 16.3 | 10.2 | 7.0 | 5.9 | 13.2 | 7.8 | 5.2 | 4.2 |
| French roll | 50.9 | 52.1 | 51.7 | 48.4 | 52.8 | 51.9 | 49.8 | 41.0 |
| Fresh fish | 8.5 | 4.5 | 3.9 | 5.5 | 21.3 | 10.7 | 8.1 | 10.5 |
| Beer | 0.8 | 2.0 | 3.2 | 5.9 | 11.1 | 30.8 | 41.5 | 64.4 |
| Coffee | 80.8 | 78.2 | 77.0 | 75.6 | 161.7 | 166.8 | 169.4 | 154.0 |
| Pizza | 1.0 | 1.9 | 3.4 | 4.6 | 1.8 | 4.9 | 9.0 | 12.5 |
| Fried and baked snacks | 6.8 | 9.0 | 11.0 | 15.7 | 5.5 | 6.7 | 9.8 | 14.4 |
| Sandwiches | 8.3 | 12.4 | 15.3 | 21.4 | 13.7 | 19.9 | 23.1 | 29.9 |
| Source: IBGE, Diretoria de Pesquisas, Coordenação de Trabalho e Rendimento, Pesquisa de Orçamentos Familiares 2017-2018. (1) Related to the first day of the 24-hour reminiscence. |
||||||||
For many items, the consumption away from home tended to increase with the increase of the income, highlighted by some vegetables and fruits, soft drinks (40.7% among those with higher income, whereas the other income brackets showed percentages lower than 30%); beef and salted cookies (more than twice among those with higher income compared with those with lower income) and fresh fish (six times higher among those with higher income compared with those with lower income). Nevertheless, the consumption away from home was higher in the first income brackets for ham, yogurt, chips and pizza.
More than half of the calories consumed come from fresh or minimally-processed food
According to NOVA classification, which classifies food according to the processing degree, slightly more than half (53.4%) of the calories consumed by the population aged 10 years and over came from fresh or minimally-processed food, 15.6% from processed culinary ingredients, 11.3% from processed food and 19.7% from highly-processed food.
Among the fresh and minimally-processed food, rice corresponded to 11.1% of the total calories, followed by beef (7.4%), beans (6.6%) and poultry (5.4%). Among the processed culinary ingredients, vegetable oil corresponded to 7.7% of the total calories, followed by sugar (5.8%). Of the processed food, the group that mostly contributed to the total calories was that of bread (8.2%), followed by cheese (1.6%). Among the highly-processed food, margarine corresponded to 2.8% of the total calories, followed by salty cookies and snacks (2.5%) and bread (2.1%).
In the assessment by age bracket, the share of fresh or minimally-processed food, as well as of processed culinary ingredients and processed food, was smaller among teenagers, intermediate among adults and higher among elderly persons. On the other hand, highly-processed food represented 26.7% of the total calories in teenagers, 19.5% in adults and 15.1% in elderly persons.
85.4% of the population add sugar to coffee, juices and other ready-cooked preparations
In addition to the detailed assessment of the food consumption, general characteristics of the food consumption of the Brazilian population were also assessed, like the addition of salt to ready-cooked preparations, use of sugar or artificial sweeteners to sweeten food and use of food supplements in the 30-day period before the survey, as well as the undertaking of some type of food restriction.
The addition of salt to ready-cooked preparations was reported by 13.5% of the population and it was more frequent among adult men (16.5%). The addition of sugar was reported by 85.4% of the population and elderly women were the group that reported the use of sugar in smaller proportion (69.2%).
In general, 19.2% of the persons reported the use of at least one food supplement in the period of 30 days before the survey, being 10.1% among teenagers, 19.2% among adults and 34.0% among elderly persons. Women consumed the most, particularly elderly women (41.0%), who reported in higher proportion the use of supplements with calcium (21.3%) and vitamins (19.5%). Supplements based on proteins and other supplements for athletes were reported by 1.7% of the entire population.
Nearly 13.9% of the population were under food restriction and women prevailed the most. Food restrictions to lose weight were more frequent in adult women (9.4%) and food restrictions related to chronic diseases or metabolic disorders (high pressure, hypercholesterolemia, diabetes mellitus or cardiovascular diseases) were reported by 26.8% of elderly women and 19.1% of elderly men.
In ten years, consumption of beans and rice drops and that of raw salad and sandwiches increases
The comparison between the individual food consumption registered in POF 2008-2009 and the current survey showed that the consumption of beans changed from 72.8% to 60.0%, whereas bean preparations changed from 3.0% to 12.0%. The frequency of consumption of rice changed from 84.0% to 76.1% and rice preparations varied from 1.4% to 2.8%. The frequency of consumption of raw salad significantly increased from 16.0% to 21.8%, as well as that of sandwiches, which varied from 8.3% to 13.8%. Smaller increases were recorded by other legumes (from 4.4% to 8.5%), poultry (from 27.0% to 30.8%) and poultry preparations (from 0.6% to 3.6%). The frequency of consumption of beef changed from 48.7% to 38.2% and that of soft drinks fell from 23.0% to 15.4%.
The differences of consumption between the urban and rural areas noticed in 2008-2009 were also present in 2017-2018. In the two periods, the frequency of consumption of cassava flour was nearly three times higher in the rural area than in the urban area. The consumption of raw salad increased both in the urban area (from 17.1% to 23.0%) and in the rural area (from 10.2% to 14.7%). The frequency of consumption of whole-grain bread changed from 2.1% to 4.2% in the urban area and from 0.9% to 1.1% in the rural area. The frequency of consumption of pig meat rose from 3.7% to 6.2% in the urban area and from 6.3% to 9.9% in the rural area, whereas the frequency of consumption of beef dropped in both areas.
Consumption of rice drops in the Central-West, South and Southeast
In the regional analysis, the frequency of consumption of rice fell approximately eight percentage points in the Central-West, South and Southeast, whereas rice preparations increased from 3.3% to 6.1% in the South and from 1.5% to 4.0% in the Central-West Region. The consumption of green/corda beans increased from 9.8% to 13.5% in the Northeast. The frequency of consumption of acai changed from 9.0% to 12.4% in the North, whereas other regions posted a slight increase, except for the Southeast Region, which maintained the percentage. Beef reduced in all the regions. Poultry increased in the North, Northeast and Southeast, and reduced in the South and Central-West.
Consumption of fruits drops among teenagers
In the analysis by age bracket, the reduction in the consumption of beans, fruits, milk and dairy products, beef, juices and soft drinks and the increase in the consumption of poultry and swine, raw salad, sandwiches and pizza in the three age groups stood out. The decrease in the consumption of beans and beef was similar for all the groups. The decrease in the consumption of fruits was steeper among teenagers. For milk, dairy products and milk preparations, the most significant drop in the frequency was registered by adults and the most intense reduction in the consumption of juices and soft drinks was recorded by elderly persons.
Drop in the consumption of rice is sharper in the highest income stratum
The frequency of consumption of rice reduced in all the income quarters, though the steepest reduction was in the last income quarter: from 79.9% to 67.1%. The consumption of wholegrain rice also reduced in the first three income quarters, yet it increased from 4.7% to 5.2% in the last income quarter. Some vegetables like lettuce, tomatoes and potatoes decreased in all income brackets, though cabbage, sweet potatoes, raw salad and other legumes rose in all the strata.
The consumption of pineapple, oranges, apples and tangerine reduced in all income brackets and that of acai increased in all the income quarters. For banana, papaya and other fruits, the consumption rose only in the two higher income quarters and, for mangoes, only in the last quarter. The consumption of French roll reduced in general and the most significant reduction was in the highest income bracket: from 67.3% to 48.4%. For wholegrain bread, the frequency nearly doubled in the highest income quarter, changing from 5.2% to 9.6%.
Pig meat and poultry increased their frequency of consumption in all the income brackets. Fresh fish and eggs only increased their frequency of consumption in the last income quarter and reduced in the other brackets. The frequency of consumption of juices rose in the two lowest income quarters and reduced in the two highest income quarters. The frequency of consumption of soft drinks reduced in all the income brackets, though the reduction was sharper in the highest income brackets, changing from 31.2% to 17.7% in the last quarter, whereas it changed from 14.4% to 11.5% in the first quarter.
Frequency of food consumption away from home drops
The food consumption away from home dropped in Brazil between 2008-2009 and 2017-2018, changing from 40.2% to 36.5% of the population. The biggest reduction was registered in the North, where the percentage of the food consumption away from home changed from 42.6% to 30.5%. In the Southeast, the reduction was from 43.7% to 36.1% and in the South, from 40.7% to 38.5%. On the other hand, the Central-West recorded an increase from 42.0% to 47.7% and the Northeast, from 33.5% to 34.8%. The average contribution of the food consumption away from home to the daily intake of energy in Brazil fell 22% between 2008-2009 and 2017-2018, dropping in all the Major Regions.
Both in 2008-2009 and in 2017-2018, food consumption away from home was bigger among teenagers than among adults and elderly persons. Elderly persons posted the lowest proportions, even increasing the consumption by nearly 20%. Teenagers and adults dropped (10% and 8%, respectively). In addition, the contribution of food consumption away from home to the daily intake of energy decreased in the three age strata, being higher in adults (reduction of 21%) than in teenagers (18%) and elderly persons (14%).
Consumption away from home in the rural area was smaller than in the urban area. However, the difference of 15 p.p. in 2008-2009 changed to 10 p.p. This reduction was due to the fact that the rural area remained virtually unchanged and the urban area reduced nearly 11%, from 42.8% to 38.0% between the two periods. The same behavior was noticed concerning the percentage contribution of the consumption away from home to the total energy intake.
Population ingests less saturated fat, yet also less fibers
The average energy intake of the population was similar in the two periods under analysis. For the male population, it varied from 1,709.0 kcal to 2,022.7 kcal in 2017-2018 and from 1,680.0 kcal to 1,996.6 kcal in 2008-2009, according to the age groups. In the female population, this variation was from 1,409.8 kcal to 1,681.8 kcal in 2017-2018 and from 1,410.0 kcal to 1,752.0 kcal in 2008-2009.
The percentage contribution of proteins, carbohydrates and fats to the total intake of energy was also similar in the two periods, varying from 17% to 19% for proteins, from 53% to 57% for carbohydrates and from 28% to 30% for fats in both sexes.
The reduction of the content of fiber in the diet stood out, mainly among elderly women, changing from 20.5 g in 2008-2009 to 15.6 g in 2017-2018. This reduction may point out a deterioration in the food quality, being compatible with the decrease in the consumption of beans, which is one of the food in the Brazilian diet that provides most food fibers.
On the other hand, a positive change in the consumption of saturated fatty acids was noticed, whose contribution to the energy intake reduced and remained below 10% in both sexes and in the three age brackets. This reduction could be attributed to the decrease in the consumption of beef.
In contrast, the daily average consumption of added sugar (table sugar and that added to preparations and processed and highly-processes food) increased in the comparison between the two periods in the three age groups and in both sexes, both in absolute figures and as a proportion to the energy consumption, being higher among teenagers.
Nevertheless, the proportion of persons who reported to use sugar fell from 85.4% to 80.3%. In this period, the proportion of the population that reported to use neither sugar nor sweetener to sweeten food and beverages increased from 1.6% to 6.1%, and the use of artificial sweeteners rose from 7.6% to 8.5%.
More than half of the population intakes sodium above the acceptable limit
The frequency of intake of sodium above the acceptable limit was of 53.5% in 2017-2018, higher in adult men (74.2%) and reduced in elderly women (25.8%).
POF also analyzed the percentage of individuals with a consumption below the average need of minerals calcium, magnesium, phosphorus, iron, copper and zinc and of vitamins A, thiamine (B1), riboflavin (B2), pyridoxine (B6), cobalamin (B12), D, E, C and folate.
Nearly 85% of the teenagers of both sexes consumed few calcium, vitamin D and vitamin E and, between 50% and 85% of them, ingested few magnesium, phosphorus, vitamin A and pyridoxine.
Among adults, the nutrients with inadequacy above 85% were calcium, vitamin A, pyridoxine, vitamin D and vitamin E, for both sexes. Magnesium vitamin A, thiamine and riboflavin showed inadequacy between 50% and 85%.
For the elderly persons of both sexes, the nutrients with inadequate intake above 50% were calcium, magnesium, vitamin A, thiamine, pyridoxine, vitamin D and vitamin E. For elderly men, the inadequacy of intake of magnesium was also significant in 2017-2018 (80.5%) and, for elderly women, the inadequate intake of folate stood out, reaching 50.2%.