
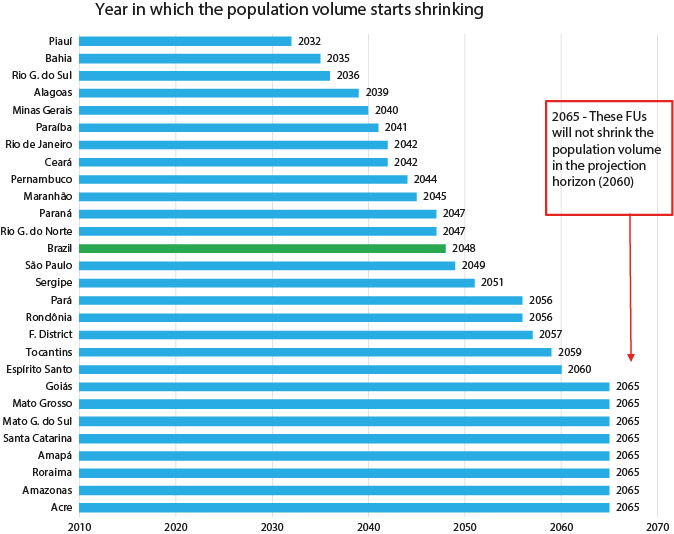
The country's population is expected to grow until 2047, reaching 233.2 million persons. In the following years, it will fall gradually until it gets to 228.3 million in 2060. These are some of the information from the 2018 revision of the IBGE Population Projection, which demographically estimates the growth patterns of the country's population, by sex and age, year per year, up to 2060.
By 2060, a quarter of the population (25.5%) is expected to be over 65. In that same year, the country would have 67.2 persons aged under 15 and above 65 for each group of 100 working-age persons (15 to 64 years old).
Regarding international migration, the projection considered the emigration from Venezuela to Roraima between 2015 and 2022. During this period, about 79,000 Venezuelans would migrate to the state.
The total fertility rate for 2018 is 1.77 children per woman. By 2060, the average number of children per woman is expected to decline to 1.66. Among the states, the highest fertility rates will be in Roraima (1.95), followed by Pará, Amapá, Maranhão, Mato Grosso, Mato Grosso do Sul, all with 1.80. The lowest rates should be in the Federal District (1.50) and in Goiás, Rio de Janeiro and Minas Gerais, all with 1.55. The average age at which women have children is 27.2 years in 2018 and it is expected to reach 28.8 years in 2060.
The 2018 revision extended the Population Projection to Federation Units until 2060. Santa Catarina, which today has the highest life expectancy at birth for both sexes (79.7 years old), is expected to maintain this leadership until 2060, reaching 84.5 years old. On the other hand, Maranhão (71.1 years old) has the lowest life expectancy at birth in 2018, a position that should be taken by Piauí in 2060 (77.0 years old).
The projection details the growth dynamics of the Brazilian population, monitors its main variables (fertility, mortality and migrations) and provides a projection of the number of inhabitants in Brazil and in the 27 Federation Units, year on year, from 2010 to 2060. This demographic study is carried out in partnership with planning bodies in almost all Brazilian states, following the recommendations of the United Nations Population Division. The 2018 Population Projection support material is on the right of this page.
In 2060, population is expected to return to levels close to 2034
The total projected population for the country in 2018 is 208.5 million. This number will increase to reach a maximum of 233.2 million in 2047. From that year on, the population will decrease to reach 228.3 million in 2060, an equivalent figure to that of 2034 (228.4 million).
The total fertility rate (average number of children per woman) projected for 2018 is 1.77 children per woman, and is expected to decline to 1.66 by 2060. The 2018 review showed that the aging of the fertility pattern is determined by the increasing number of women who get pregnant between the ages of 30 and 39 and the decreasing participation of women between 15 and 24 years old in the fertility rate in all the Major Regions of the country.
Average age at which women have children should be 28.8 years old in 2060
In addition to declining fertility levels, it is projected that the age-standard of fertility for women will also change, as it has been observed in the last decades, towards an aging of fertility in Brazil. The average age at which women have children, which is 27.2 years in 2018, is expected to reach 28.8 years in 2060.
One quarter of the population is expected to be over 65 in 2060
In 2060, the percentage of the population aged 65 and above will reach 25.5% (58.2 million elderly), while in 2018 this proportion is 9.2% (19.2 million). Young people (0 to 14 years old) should represent 14.7% of the population (33.6 million) in 2060, compared to 21.9% (44.5 million) in 2018.
Aging affects the population dependency ratio, which is represented by the ratio between the segments considered to be economically dependent (people under 15 and 65 years of age or older) and the potentially productive age group (15 to 64 years), which is the proportion of the population that, in theory, should support the economically inactive portion.
The population dependency ratio in 2018 is 44%. This indicator means that 44 individuals under the age of 15 and over the age of 64 depend on each group of 100 working-age persons (15-64 years old). In 2039, the total dependency ratio should be 51.5%, when the proportion of young people (25.7%) and elderly people (25.8%) will be equivalent. This total proportion is expected to increase to 67.2% in 2060.
In 2010, the dependency ratio was 47.1%, and reached its minimum value in 2017 (44.0%). From then on, this proportion would grow again, reaching, in 2028, 47.4%, the same level of 2010.
Roraima is expected to have the highest fertility rate in 2060: 1.95 children per woman
Currently, the states of the North and Maranhão (1.93), Espírito Santo (1.83), Paraná (1.80) and Goiás (1.79) have the total fertility rate above the national average. Roraima (2.31), Amazonas (2.28), Acre (2.22), and Amapá (2.11) are the only ones with fertility above the replacement level in 2018 (2.1 children per woman).
In 2060, Roraima should continue with the highest fertility rate (1.95), followed by Pará, Amapá, Maranhão, Mato Grosso, Mato Grosso do Sul, all with 1.80. The lowest rate should occurr in the Federal District (1.50) and Goiás, Rio de Janeiro and Minas Gerais, all with 1.55.
Total estimated and projected fertility rates - 2000/2060
| Federation Units | Fertility rates | ||||||||
|---|---|---|---|---|---|---|---|---|---|
| Estimated | Projected | ||||||||
| 2000 | 2010 | 2015 | 2018 | 2020 | 2030 | 2040 | 2050 | 2060 | |
| Brazil | 2.32 | 1.75 | 1.80 | 1.77 | 1.76 | 1.72 | 1.69 | 1.67 | 1.66 |
| North | 3.14 | 2.21 | 2.11 | 2.03 | 2.00 | 1.88 | 1.83 | 1.81 | 1.80 |
| Rondônia | 2.55 | 1.84 | 1.88 | 1.88 | 1.87 | 1.82 | 1.79 | 1.77 | 1.76 |
| Acre | 3.94 | 2.45 | 2.37 | 2.22 | 2.14 | 1.89 | 1.80 | 1.77 | 1.75 |
| Amazonas | 3.43 | 2.47 | 2.39 | 2.28 | 2.22 | 2.01 | 1.89 | 1.83 | 1.79 |
| Roraima | 3.50 | 2.48 | 2.30 | 2.31 | 2.25 | 2.06 | 1.99 | 1.96 | 1.95 |
| Pará | 3.09 | 2.14 | 1.99 | 1.92 | 1.89 | 1.82 | 1.80 | 1.80 | 1.80 |
| Amapá | 3.82 | 2.55 | 2.29 | 2.11 | 2.04 | 1.86 | 1.82 | 1.80 | 1.80 |
| Tocantins | 2.73 | 2.03 | 1.96 | 1.93 | 1.91 | 1.83 | 1.80 | 1.79 | 1.78 |
| Northeast | 2.59 | 1.82 | 1.78 | 1.75 | 1.73 | 1.69 | 1.67 | 1.66 | 1.66 |
| Maranhão | 3.25 | 2.12 | 1.95 | 1.93 | 1.90 | 1.83 | 1.81 | 1.80 | 1.80 |
| Piauí | 2.70 | 1.80 | 1.77 | 1.76 | 1.75 | 1.71 | 1.70 | 1.69 | 1.69 |
| Ceará | 2.60 | 1.75 | 1.74 | 1.70 | 1.69 | 1.66 | 1.65 | 1.64 | 1.64 |
| Rio Grande do Norte | 2.45 | 1.73 | 1.72 | 1.65 | 1.65 | 1.64 | 1.64 | 1.64 | 1.64 |
| Paraíba | 2.45 | 1.76 | 1.79 | 1.76 | 1.74 | 1.69 | 1.67 | 1.65 | 1.64 |
| Pernambuco | 2.46 | 1.79 | 1.83 | 1.76 | 1.74 | 1.68 | 1.66 | 1.65 | 1.64 |
| Alagoas | 2.90 | 2.00 | 1.83 | 1.76 | 1.74 | 1.69 | 1.68 | 1.68 | 1.68 |
| Sergipe | 2.68 | 1.82 | 1.78 | 1.74 | 1.72 | 1.67 | 1.66 | 1.65 | 1.65 |
| Bahia | 2.37 | 1.73 | 1.68 | 1.69 | 1.68 | 1.64 | 1.63 | 1.62 | 1.62 |
| Southeast | 2.07 | 1.63 | 1.73 | 1.70 | 1.70 | 1.68 | 1.65 | 1.63 | 1.61 |
| Minas Gerais | 2.14 | 1.57 | 1.62 | 1.62 | 1.61 | 1.60 | 1.58 | 1.57 | 1.55 |
| Espírito Santo | 2.17 | 1.73 | 1.85 | 1.83 | 1.83 | 1.79 | 1.75 | 1.71 | 1.67 |
| Rio de Janeiro | 2.03 | 1.59 | 1.75 | 1.74 | 1.73 | 1.68 | 1.64 | 1.59 | 1.55 |
| São Paulo | 2.04 | 1.67 | 1.77 | 1.72 | 1.72 | 1.70 | 1.68 | 1.67 | 1.65 |
| South | 2.15 | 1.63 | 1.77 | 1.74 | 1.74 | 1.72 | 1.71 | 1.69 | 1.68 |
| Paraná | 2.19 | 1.72 | 1.80 | 1.80 | 1.79 | 1.76 | 1.74 | 1.71 | 1.68 |
| Santa Catarina | 2.10 | 1.60 | 1.74 | 1.74 | 1.74 | 1.72 | 1.71 | 1.69 | 1.68 |
| Rio Grande do Sul | 2.13 | 1.56 | 1.74 | 1.68 | 1.68 | 1.68 | 1.68 | 1.68 | 1.68 |
| Central-West | 2.16 | 1.77 | 1.90 | 1.87 | 1.85 | 1.80 | 1.75 | 1.69 | 1.63 |
| Mato Grosso do Sul | 2.33 | 1.92 | 2.04 | 2.02 | 2.01 | 1.96 | 1.91 | 1.85 | 1.80 |
| Mato Grosso | 2.35 | 1.88 | 2.08 | 2.06 | 2.05 | 1.99 | 1.92 | 1.86 | 1.80 |
| Goiás | 2.02 | 1.69 | 1.82 | 1.79 | 1.77 | 1.72 | 1.66 | 1.61 | 1.55 |
| Distrito Federal | 2.13 | 1.65 | 1.71 | 1.68 | 1.67 | 1.63 | 1.59 | 1.54 | 1.50 |
| Source: IBGE, Diretoria de Pesquisas, Coordenação de População e Indicadores Sociais | |||||||||
About 79,000 Venezuelan immigrants are estimated in Roraima by 2022
Between 2015 and 2017, 20,500 Venezuelans migrated to Roraima. This phenomenon is which is expected to increase by 185.4%, considering the projection of 58,500 between 2018 and 2022.
In the elaboration of the parameters and hypotheses for the international migration for the 2018 revision of the population projection, the migratory flows of all nationalities were monitored. The conclusion is that the entrances and exits in the national territory were compensated with a migratory balance near zero. The only exception were the flows from Venezuela, due to the local impact in Roraima.
Santa Catarina should continue with the highest life expectancy at birth until 2060
The 2018 revision brought the population projections for the Federation Units up to 2060. Santa Catarina, which today has the highest life expectancy at birth for both sexes (79.7 years old), should remain in that position, with 84.5 years old in 2060. On the other hand, Piauí should have the lowest life expectancy at birth in 2060 (77.0 years old).
Among men, the highest life expectancy values projected for 2060 will be seen in Santa Catarina, 81.5 years old, and Rio Grande do Sul, 80.9 years old, while the lowest ones will be in Piauí, of 72.7 years old, and Pará, 73.6 years old. The highest values of female life expectancy will also be in Santa Catarina, 87.6 years old, followed by Paraná, with 87.0 years old. Rondônia and Roraima will experience the lowest life expectancies among women, 80.3 years old and 80.8 years old, respectively.
Life expectancy at birth and infant mortality rate for the country are scheduled for review in 2022, after the 2020 Population Census.