Quarterly Continuous PNAD: unemployment increases in 16 of the 27 Federation Units in Q1 2023


May 18, 2023 09h00 AM | Last Updated: May 23, 2023 10h52 PM
The unemployment rate in the country in Q1 2023 reached 8.8%, havind increased by 0.9 percentage points (p.p.) from Q4 2022 (7.9%) and with a drop of 2.4 p.p. from the same quarter in 2022 (11.1%). Against the previous quarter, the unemployment rate increased in six of the 27 Federation Units, and remained remaining stable in the other 11 ones.
The highest unemployment rates were registered in Bahia (14.4%), Pernambuco (14.1%) and Amapá (12.2%), and the lowest, in Rondônia (3.2%), Santa Catarina (3.8%) and Mato Grosso (4.5%).
The unemployment rate by sex was 7.2% among men and 10.8% among women in Q1 2023. The unemployment rate by color or race stood below the national average (8.8%) for white persons (6.8%) and above that for black (11.3%) and brown (10.1%) ones.
The unemployment rate for persons with incomplete secondary education (15.2%) exceeded the rates of other levels of schooling. Among persons with incomplete higher education, the rate was 9.2%, more than twice as that observed for complete higher education (4.5%).
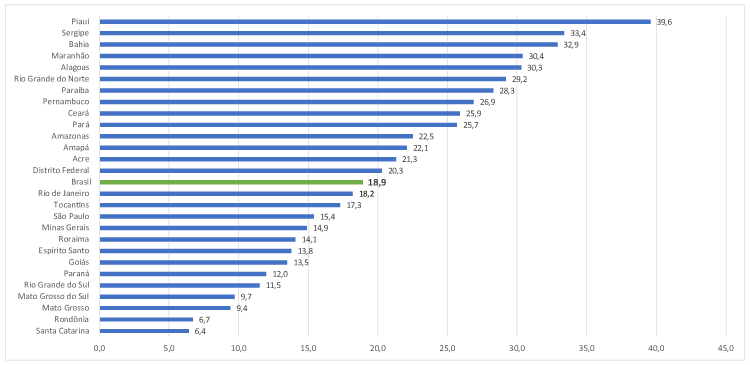
In the third quarter of 2022, the compound underutilization rate of the workforce (percentage of unemployed persons, time-related underemployed persons and in the potential workforce in relation to the extended workforce) was 18.9%. Piauí (39.6%) reported the highest rate, followed by Sergipe (33.4%) and Bahia (32.9%). The lowest underutilization rates were those of Santa Catarina (6.4%), Rondônia (6.7%) and Mato Grosso (9.4%).
In Q1 2023, 2.2 million persons had been looking for a job for two years and over. This number fell by 35.3% from the last quarter of 2022, when 3.5 million persons had been searching for work for two years and over.
The percentage of discouraged persons (against the population in the workforce or discouraged population) in Q1 2023 was 3.5%. Maranhão (14.3%), Alagoas (13.4%) and Piauí (13.0%) recorded the highest percentages of discouraged persons, whereas the lowest were in Santa Catarina (0.3%), Rondônia (0.6%) and mato Grosso do Sul (0.7%).
The percentage of employed persons with a formal contract in the private sector was 74.1%. The highest percentages were those of Santa Catarina (88.2%), Rio Grande do Sul (82.2%) and São Paulo (81.1%), and the lowestt, those of Maranhão (50.8%), Pará (51.2%) and Piauí (51.7%).
The percentage of the self-employed population in the country was 25.8%. Rondônia (37.3%), Amazonas (32.5%) and Amapá (32.3%) accounted for the highest percentages and the Federal District (20.7%), Tocantins (21.3%) and Mato Grosso do Sul (22.3%), for the lowest.
The informality rate in Brazil reached 39.0% of the employed population. The highest rates were those of Pará (59.6%), Amazonas (57.2%) and Maranhão (56.5%) and and the lowest, of Santa Catarina (26.1%), Federal District (30.3%) and São Paulo (30.6%).
The usual monthly real average earnings was R$2,880, remaining stable against the fourth quarter of 2022 (R$2,861) and with a drop against the same quarter in 2022 (R$2,682). In the quarter, results remained stable in all the Major Regions, except for the Northeast (R$ 1,979), where there was increase. In the annual comparison, all the Major Region recorded increases.
Unemployment rate increases 16 FUs and remains stable in other 11
Compared with the fourth quarter of 2022, the unemployment rate increased in 16 Federation Units and remained stable in the remaining ones. The highest unemployment rates were registered in Bahia (14.4%), Pernambuco (14.1%) and Amapá (12.2%) and, the lowest ones, in Rondônia (3.2%), Santa Catarina (3.8%) and Mato Grosso (4.5%).
previous quarter (%) - Q1 2023
| FU | 4T 2022 | Q1 2023 | status |
|---|---|---|---|
| Pernambuco | 12.3 | 14.1 | ↑ |
| Rio Grande do Norte | 9.9 | 12.1 | ↑ |
| Distrito Federal | 10.3 | 12.0 | ↑ |
| Piauí | 9.5 | 11.1 | ↑ |
| Alagoas | 9,3 | 10.6 | ↑ |
| Maranhão | 8.3 | 9.9 | ↑ |
| Pará | 8,2 | 9,8 | ↑ |
| Ceará | 7.8 | 9.6 | ↑ |
| Brazil | 7.9 | 8.8 | ↑ |
| São Paulo | 7.7 | 8.5 | ↑ |
| Tocantins | 5.2 | 6.9 | ↑ |
| Roraima | 4.6 | 6.8 | ↑ |
| Minas Gerais | 5.8 | 6.8 | ↑ |
| Rio Grande do Sul | 4.6 | 5.4 | ↑ |
| Mato Grosso do Sul | 3.3 | 4.8 | ↑ |
| Mato Grosso | 3.5 | 4.5 | ↑ |
| Santa Catarina | 3.2 | 3.8 | ↑ |
| Bahia | 13.5 | 14.4 | ⇥ |
| Amapá | 13.3 | 12.2 | ⇥ |
| Sergipe | 11.9 | 11.9 | ⇥ |
| Rio de Janeiro | 11.4 | 11.6 | ⇥ |
| Paraíba | 10.3 | 11.1 | ⇥ |
| Amazonas | 10.0 | 10.5 | ⇥ |
| Acre | 10.0 | 9.8 | ⇥ |
| Espírito Santo | 7.2 | 7.0 | ⇥ |
| Goiás | 6.6 | 6.7 | ⇥ |
| Paraná | 5.1 | 5.4 | ⇥ |
| Rondônia | 3.1 | 3.2 | ⇥ |
Piauí has highest underutilization rate (39.6%) and Santa Catarina, the lowest (6.4%)
The compound underutilization rate of the workforce was 18.9% in the third quarter of 2022. Piauí (39.6%) recorded the highest rate, followed by Sergipe (337.4%) and Bahia (32.9%). The lowest underutilization rates were those of Santa Catarina (6.4%), Rondônia (6.7%) and Mato Grosso (9.4%).
Rondônia has highest proportion of self-employed workers (37.3%) and DF, the lowest (20.7%)
The percentage of the self-employed population in the country was 25.8%. The highest percentages were registered in Rondônia (37.3%), Amazonas (32.5%) and Amapá (32.3%) and the lowest ones, in the Federal District (20.7%), Tocantins (21.3%) and Mato Grosso do Sul (22.3%).
self-employed persons, by FU (%) - Q1 2023
| FU | Value |
|---|---|
| Distrito Federal | 20.7 |
| Tocantins | 21.3 |
| Mato Grosso do Sul | 22.3 |
| Sergipe | 22.7 |
| Goiás | 22.9 |
| Paraná | 23.0 |
| São Paulo | 23.5 |
| Minas Gerais | 24.1 |
| Santa Catarina | 24.4 |
| Alagoas | 24.5 |
| Rio Grande do Sul | 24.8 |
| Espírito Santo | 25.6 |
| Brazil | 25.8 |
| Mato Grosso | 26.2 |
| Roraima | 26.7 |
| Rio de Janeiro | 27.0 |
| Rio Grande do Norte | 27.1 |
| Acre | 28.0 |
| Piauí | 28.0 |
| Ceará | 28.9 |
| Paraíba | 29.3 |
| Bahia | 29.4 |
| Pernambuco | 30.4 |
| Maranhão | 31.5 |
| Pará | 31.7 |
| Amapá | 32.3 |
| Amazonas | 32.5 |
| Rondônia | 37.3 |
Maranhão has lowest percentage (50.8%) of workers with a formal contract; Santa Catarina, the highest one (88.2%)
In the first quarter of 2023, 74.1% of the employees in the private sector had a formal labor contract. The Northeast (58.9%) and North Regions (57.6%) recorded the lowest rates. Among domestic workers, 26.1% had a formal contract in Brazil. In the same quarter in 2016, this proportion had been 25.0%.
Among the Federation Units, the highest percentages of persons employed with a formal contract in the private sector were in Santa Catarina (88.2%), Rio Grande do Sul (82.2%) and São Paulo (81.1%), and the lowest ones were in Maranhão (50.8%) and Piauí (51.7%).
in the private sector, by Federation Unit (%) - Q1 2023
| FU | Value |
|---|---|
| Maranhão | 50.8 |
| Pará | 51.2 |
| Piauí | 51.7 |
| Tocantins | 53.5 |
| Sergipe | 56.5 |
| Ceará | 56.9 |
| Bahia | 57.4 |
| Paraíba | 58.6 |
| Roraima | 60.2 |
| Alagoas | 61.9 |
| Amazonas | 63.9 |
| Rio Grande do Norte | 64.2 |
| Pernambuco | 67.6 |
| Acre | 67.9 |
| Amapá | 69.8 |
| Rondônia | 72.4 |
| Goiás | 73.4 |
| Espírito Santo | 74.1 |
| Brasil | 74.1 |
| Minas Gerais | 75.6 |
| Mato Grosso do Sul | 76.4 |
| Rio de Janeiro | 77.8 |
| Distrito Federal | 78.1 |
| Mato Grosso | 79.0 |
| Paraná | 80.4 |
| São Paulo | 81.1 |
| Rio Grande do Sul | 82.2 |
| Santa Catarina | 88.2 |
Against the previous quarter, earnings increase in the Northeast only
The usual monthly real average earnings were R$2,880, being stable against the fourth quarter of 2022 (R$2,861) and the same quarter of 2022 (R$2,682). Against the fourth quarter in 2022, the Northeast (R$1,979) was the Major Region to record an increase in earnings, whereas the other ones remained stable. In relation to Q1 2022, average earnings increased in all the Major Regions.
The average monthly wage bill from all the activities was estimated at R$ 277.2 billion, with stability against the previous quarter (R$ 279.5 billion). From Q1 2022 (R$ 250.2 billion), there was an increase of wage bill.
Pará has the highest informality rate (59.6%) and Santa Catarina, the lowest one (26.1%)
The informality rate in Brazil reached 39.0% of the employed population. The highest rates were those of Pará (59.6%), Amazonas (56.5%) and Maranhão (56.5%) and the lowest, of Santa Catarina (26.1%), Federal District (30.3%) and São Paulo (30.6%).
The calculation of informality rate of the employed population considers the following groups: Worker in the private sector without a formal employment contract; Domestic worker without a formal employment contract; Employer without a CNPJ register; Self-employed worker without a CNPJ register; and Contributing family worker.
by FU (%) - Q1 2023
| UF | Value |
|---|---|
| Pará | 59.6 |
| Amazonas | 57.2 |
| Maranhão | 56.5 |
| Bahia | 53.7 |
| Ceará | 52.7 |
| Piauí | 52.5 |
| Sergipe | 51.0 |
| Paraíba | 50.0 |
| Pernambuco | 48.9 |
| Rondônia | 48.2 |
| Roraima | 48.1 |
| Amapá | 46,6 |
| Rio Grande do Norte | 45.9 |
| Alagoas | 45.4 |
| Tocantins | 45.3 |
| Acre | 45.1 |
| Brasil | 39.0 |
| Espírito Santo | 38.7 |
| Goiás | 37.2 |
| Minas Gerais | 37.1 |
| Rio de Janeiro | 36.5 |
| Mato Grosso | 35,7 |
| Mato Grosso do Sul | 34.3 |
| Rio Grande do Sul | 32.0 |
| Paraná | 31.7 |
| São Paulo | 30.6 |
| Distrito Federal | 30.3 |
| Santa Catarina | 26.1 |
Unemployment drops in all the ranges of time searching for work
In Q1 2023, the totals of all ranges of time searching for a job recorded percent decreases, as shown in the table below: In Q1 2023, 2.2 million persons had been searching for a job for two years of more This total fell by 35.3% against the first quarter of 2022, when there were 3.5 million persons in this range. However, against the start of the time series, in the first quarter of 2012, the total of persons searching for two years and over grew by 27.4%.
| Time searching for a job | 1º Trimestre | |||||||||||
|---|---|---|---|---|---|---|---|---|---|---|---|---|
| 2012 | 2013 | 2014 | 2015 | 2016 | 2017 | 2018 | 2019 | 2020 | 2021 | 2022 | 2023 | |
| Less than 1 month | 1 137 | 1 163 | 1 026 | 1 037 | 1 299 | 1 773 | 2 046 | 2 164 | 2 371 | 1 866 | 2 060 | 1 970 |
| Between 1 month and less than 1 year | 3 767 | 4 242 | 3 762 | 4 369 | 5 906 | 7 076 | 6 488 | 6 206 | 6 018 | 7 206 | 4 879 | 4 242 |
| Between 1 year and less than 2 years | 990 | 1 056 | 1 035 | 1 259 | 2 037 | 2 569 | 2 288 | 1 920 | 1 647 | 2 600 | 1 546 | 979 |
| 2 years and over | 1 759 | 1 405 | 1 318 | 1 380 | 2 039 | 2 887 | 3 051 | 3 361 | 3 112 | 3 585 | 3 463 | 2 241 |
| Time searching for a job | Percentage change | |||||||||||
| 2013/ 2012 |
2014/ 2013 |
2015/ 2014 |
2016/ 2015 |
2017/ 2016 |
2018/ 2017 |
2019/ 2018 |
2020/ 2019 |
2021/ 2020 |
2022/ 2021 |
2023/ 2022 |
2023/ 2012 |
|
| Less than 1 month | 2.3 | -11.8 | 1.1 | 25.3 | 36.5 | 15.4 | 5.8 | 9.6 | -21.3 | 10.4 | -4.4 | 73.3 |
| Between 1 month and less than 1 year | 12.6 | -11.3 | 16.1 | 35.2 | 19.8 | -8.3 | -4.3 | -3.0 | 19.7 | -32.3 | -13.1 | 12.6 |
| Between 1 year and less than 2 years | 6.7 | -2.0 | 21.6 | 61.8 | 26.1 | -10.9 | -16.1 | -14.2 | 57.9 | -40.5 | -36.7 | -1.1 |
| 2 years and over | -20.1 | -6.2 | 4.7 | 47.8 | 41.6 | 5.7 | 10.2 | -7.4 | 15.2 | -3.4 | -35.3 | 27.4 |


