GDP increases 1.8%, reaches R$7.0 trillion in 2018


November 06, 2020 10h00 AM | Last Updated: November 09, 2020 04h36 PM
The Gross Domestic Product - GDP hit R$7.0 trillion in 2018, a rise of 1.8% over 2017. The per capita GDP reached R$33,593.82, a rise of 1.0% in relation to the previous year.
Agriculture grew 1.3%, Industry, 0.7% and Services, 2.1%.
Household consumption grew 2.3% The final consumption expenditure of the government increased 4.9% in nominal terms.
In 2018, Gross Fixed Capital Formation - GFCF rose 5.2%, after four consecutive years of drops, and the investment rate (15.1%) grew 0.5%, after reaching in 2017 its lowest level since 1995.
This is part of the information that comprises the System of National Accounts 2018, which includes more comprehensive and detailed data from the IBGE and external sources, which revise the results of the Quarterly National Accounts.
| Major indicators | 2010 | 2011 | 2012 | 2013 | 2014 | 2015 | 2016 | 2017 | 2018 |
|---|---|---|---|---|---|---|---|---|---|
| GDP (% change) | 7,5 | 4,0 | 1,9 | 3,0 | 0,5 | -3,5 | -3,3 | 1,3 | 1,8 |
| GDP (R$ billion) | 3.886 | 4.376 | 4.815 | 5.332 | 5.779 | 5.996 | 6.269 | 6.585 | 7.004 |
| Per capita GDP (R$) | 19.939 | 22.260 | 24.278 | 26.658 | 28.649 | 29.467 | 30.559 | 31.844 | 33.594 |
| Final consumption expenditure (% change) | 5,7 | 4,2 | 3,2 | 3,0 | 1,9 | -2,8 | -2,9 | 1,3 | 2,0 |
| GFCF (percentage change in volume) | 17,9 | 6,8 | 0,8 | 5,8 | -4,2 | -13,9 | -12,1 | -2,6 | 5,2 |
| Investment rate - GFCF/GDP (%) | 20,5 | 20,6 | 20,7 | 20,9 | 19,9 | 17,8 | 15,5 | 14,6 | 15,1 |
| Compensation of employees/GDP (%) | 41,6 | 42,2 | 42,8 | 43,2 | 43,5 | 44,6 | 44,7 | 44,3 | 43,6 |
| Source: IBGE, Diretoria de Pesquisas, Coordenação de Contas Nacionais. | |||||||||
The increase of the Gross Domestic Product - GDP in 2018 was revised from 1.3% to 1.8%. This revision was mainly due to the incorporation of new data coming from the Annual Survey of Services - PAS and data from the Income Revenue, for the whole set of Services activities (+0.6%), particularly for Other services activities (+2.0%). Services account for nearly 2/3 of the Brazilian economy.
After the change of 1.3% in 2017, the rate of 1.8% in 2018 was the second rise of the GDP in a row. These rises were insufficient to reverse the cumulative drop in the 2015-2016 biennium (6.7%). At current values, the GDP was R$7.004 trillion in 2018, which corresponded to a per capita GDP of R$33,593.82 The growth of the per capita GDP was of 1.0%, taking its level closer to that registered in 2010, in real terms.
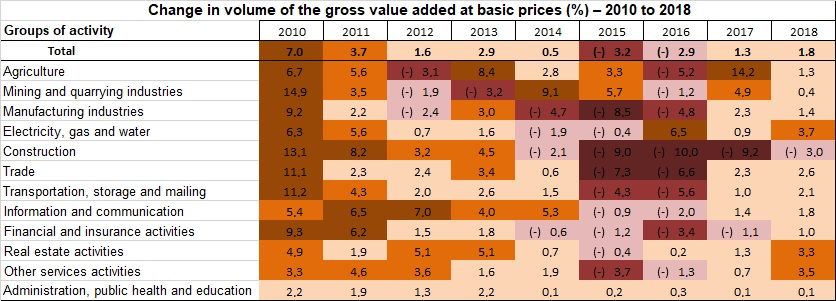
The growth of the GDP in 2018 was due to an increase of 1.8% in the Gross Value Added - GVA, highlighted by the group of Services, which grew 2.1%. In 2018, 11 out of the 12 groups of economic activities grew or remained stable, being the only drop recorded in the Construction activity.
Services (2.1%), which account for two thirds of the Brazilian economy, were responsible for 1.5 percentage points out of the growth of 1.8% in the GVA. Agriculture increased 1.3% and contributed with 0.1 percentage points to the growth of the Value Added. Industry posted a positive change of 0.7%, contributing with 0.2 percentage points.
Trade advanced 2.6%, contributed with 0.3 percentage points to the growth, influenced by trade of vehicles, with a rise in the volume of trade margins of cars (+16.4%), trucks (+63.5%) and car pieces (+8.3%).
Real estate activities increased 3.3% (0.3 p.p. in the growth of GVA), mainly impacted by the increasing production of effective rent and real estate services (4.0%) and imputed rent (2.9%).
Other services activities, on their turn, grew 3.5% (0.6 p.p. in the growth of GVA), highlighted by Food services (+4.9%), Private health (+4.4%) and Other administrative activities and complementary services (+3.3%).
The activity of Electricity and gas, water, sewage and waste management activities grew 3.7%, due to an increase in Production volume (+1.9%) above the Intermediate consumption (+0.5%), as a result of the smaller use of thermoelectric plants in relation to 2017.
Having maintained a series of negative results since 2014, Construction was the only activity group with a drop in volume in the GVA in 2018, with a performance of -3.0%.
Household consumption grows 2.3%
In 2018, final consumption expenditure grew 2.0%. Having fallen 0.7% in 2017, the final consumption expenditure of the government, which encompasses the expenditures with goods and services supplied by the government to the public, increased 0.8% in 2018.
Household consumption, which weights the most in the final demand (63.2% of the GDP), rose 2.3%. The change in the prices of goods and services consumed by households was of 4.0%. Most of the groups of products that comprise these expenditures registered positive changes in volume in 2018, except for Education (-0.1%) and Wearing apparel (-0.6%). Among the products that mostly contributed to the increase in the consumption of households, household articles (+4.0%), health (+4.0%) and transportation (+3.1%) stood out.
Gross Fixed Capital Formation advanced 5.2% after four years of drops
Gross fixed capital formation - GFCF of the Brazilian economy added up to R$1.1 trillion in 2018, rising 5.2%, its first positive figure after four consecutive years of drops. The investment rate (GFCF/GDP) was 15.1%, rising 0.5 p.p. over 2017, when the lowest rate of the time series started in 1995 was recorded.
Construction remained as the most relevant group among the GFCF components, yet its representativeness decreased once again in 2018, changing from 49.6% in 2017 to 45.3%. The second most important, Machinery and equipment, increased its relevance, changing from 35.6% to 40.3%. The share of Intellectual property products remained virtually unchanged, changing from 12.7% in 2017 to 12.4%.
Concerning the change in volume of the GFCF components, Construction and Other fixed assets retracted in 2018, with a change of -1.5% and -0.8%, respectively. The investment in Machinery and equipment grew 15.4% and, in Intellectual property products, 4.3%.
In addition, exports grew 4.1% in 2018 and imports, 7.7%, resulting in a negative contribution of the external balance to the GDP change (-0.4%).
Net borrowing of national economy rises 147.6%
In 2018, net borrowing of the Brazilian economy was of R$166.7 billion, a rise of 147.6% over 2017, when it hit R$67.4 billion. The worsening was widespread in the transactions with the rest of the world, encompassing the performance of foreign trade, net property income sent to the rest of the world (biggest impact), as well as other net transfers sent abroad.
The external balance of goods and services was of R$27.6 billion, a nominal drop of R$19.7 billion (41.7%) over 2017. Net property income sent to the rest of the world rose, changing from R$124.0 billion in 2017 to R$195.7 billion in 2018, contributing with R$71.6 billion to worsen the Brazilian net borrowing.
The sector of non-financial enterprises resumed net borrowing in 2018. It is rare, even in adverse circumstances, to register net lending in this sector, even more along a full triennium, as it was recorded between 2015 and 2017. Therefore, the return of net borrowing in this sector pointed out a return to normal.
Having changed from R$187.9 billion in 2017 to R$149.8 billion in 2018, net lending of the financial enterprises posted a nominal drop of 20.3%. Gross value added registered a nominal reduction of 1.7% over 2017, hitting R$419.9 billion. It was due to the reduction of the interest rate. The increase of 31.8% in the dividend payment by enterprises, the growth of 21.5% of taxes and the rise of 20.5% of gross fixed capital formation, reflecting investments in information technology, also contributed to the drop in net lending of this sector.
Having changed from R$465.2 billion in 2017 to R$429.1 billion in 2018, the general government sector recorded a drop in net borrowing of R$35.9 billion. Such behavior was mostly influenced by the growth of 8.0% of the total revenue compared with a change of 4.9% of the total expenditures of the three government spheres. Registered in 2017 and not repeated in 2018, the withdrawal of FGTS inactive accounts was one of the major factors to decelerate the expenditures.
Gross fixed capital formation of this sector reversed the dropping trend of the last three years and changed from R$109.2 billion in 2017 to R$119.2 billion in 2018, recording a growth of nearly 9.1% in nominal terms. Such movement was especially influenced by the increase in investments in the municipal sphere.
Social contributions paid by households increased 4.4%
The share of compensation in the available income of the households grew up to 2011, when it hit the top level of 65.3% of the total, at current values, in the time series. Until 2017, all the subsequent years registered a drop in this relation. In 2018, the relation remained stable at 62.1%.
The consumed income, i.e., the parcel of the final consumption of the households in the available income, fell up to 2017 (88.3%), increasing to 89.9% in 2018. Between 2014 and 2016, the share of the savings in the available income increased from 10.1% to 12.1%, whereas it dropped to 10.8% in 2018.
In 2018, social benefits received by households grew only 1.6% in nominal terms, whereas social contribution of the sector increased 4.4%. The reason why social benefits slightly increased was due to the withdrawal of FGTS accounts in 2017, which was not repeated in 2018. This fact and the nominal increase of 6.4% in the final consumption expenditure, resulted in a drop of 19.6% in the net lending of this sector, which changed from R$202.1 billion in 2017 to R$162.5 billion in 2018.
