Continuous PNAD 2019: water supply in the Central West reaches levels recorded before water restriction period


May 06, 2020 10h00 AM | Last Updated: May 07, 2020 03h21 PM
In 2019, the country had 72.4 million housing units, out of which a total 70.7 million (97.6%) had piped water and 63.8 million (88.2%), access to the general supply system.
In 85.5% of the housing units, the general system was the main source of water supply. The Northeast Region (69.0%) had the smallest daily supply coverage, whereas the South (97.0%), the biggest. Compared to figures in 2018, the Central West region advanced in terms of the daily capacity of the general water supply system, with a change from 87.1% (2018) to 94.9% (2019, having recovered the level reached before the supply caused by drought in the Major Region in 2016) (94.7%).
In the North Region, 21.3% of the housing units had access to water from a deep or artesian well and 13.4% made use of a shallow well, water table or container. In the Northeast, 6.1% of the housing units had other type of water supply, such as, for example: rainwater harvesting in cisterns, tanks, water from rivers, dams, or from water trucks.
The survey shows that 97.8% of the housing units in the country (70.8 million) had a bathroom for exclusive use and in 68.3% (49.1 million) sewer was disposed by means of a general system or a septic tank linked to the system. The percentage of housing units with a bathroom for exclusive use in the unit ranged from 90.2%, in the North Region, to 99.8%, in the South.
The proportion of housing units with access to the general system changed from 66.3% in 2018 to 68.3% in 2019. There are still significant differences among the Major Regions: in 2019, the North (27.4%) and the Northeast (47.2%) had the smallest coverage levels, whereas the Southeast reached an estimated 88.9%; the South and Central West recorded figures of 68.7% and 60.0%, respectively. All the Major Regions recorded increases against 2018.
The percentage of housing units with garbage collection by a sanitation company was 84.4%, an increase of 2.1 million housing units (or 3.6%) in a year. In 7.0% of the housing units, garbage was disposed in a container by a sanitation company, whereas in 7.4%, garbage was burned in the property.
In 2019, the access to electricity in housing units was virtually widespread, with availability of that type of service in 99.8% of the housing units, supplied by either the general system or an alternative source.
The availability of a refrigerator found the highest percentage in housing units, having surpassed 90% in all the Major Regions. The washing machine was present in 66.1% of the housing units in the country, with striking differences by Major Region: the smallest percentages were in the North (44.3%) and Northeast (37.0%), and the biggest in the Southeast (79.1%), South (85.8%) and Central West (73.7%).
In almost half (49.2%) of the Brazilian housing units there was a car, whereas 22.2% had a motorcycle and 11.7%, both. In the North and Northeast, the proportions of housing units with a motorcycle (respectively 31.8% and 30.4%) surpassed the percentages of car ownership in those Major Regions.
From 2012 to 2019, the participation of the white population fella participação from 46.6% to 42.7%. All the Major Regions recorded decrease, mainly the Southeast (5.0 percentage points) and South (5.8 percentage points). These are some of the data in the General Characteristics of Housing Units and Residents of the Continuous National Household Sample Survey (PNAD-C) 2019. The support material for this release can be found on the right of the page.
Central West recovers water supply after crisis of 2016
Among the 72.4 million housing units in the country, 97.6% (70.7 million) had piped water and 88.2% (63.8 million) had access to the general water supply system in 2019. In 85.5% of the housing units, the main source of water supply was the general supply system – by area, ranging from 58.8% in the North to 92.3% in the Southeast.
The use of a deep or artesian well; shallow well, water table or container; source or spring and others as the main form of supply recorded estimates of 7.1%, 3.2%, 2.1% and 2.0%, respectively. In the North Region, 21.3% of the housing units had water supply from a deep or artesian well and 13.4% made use of a shallow well, water table or container. In the Northeast, 6.1% of the housing units had other form of water supply, such as, for example: rainwater harvesting from cisterns, tanks, river water, streams or water trucks.
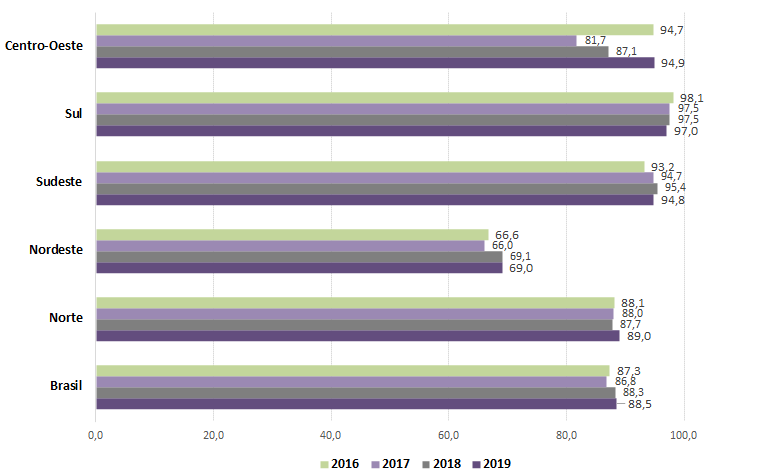
Among the housing units that have the general system as the main source of water supply, the availability/frequency of this service was investigated. In 88.5% there was daily availability, decreasing to about 5.0% in the cases of frequency of 4 to 6 times a week or 1 to 3 times a week. The Northeast Region (69.0%) had the lowest daily coverage of water supply, whereas the South (97.0%) had the recorded the highest. Against 2018, the North and Central West Regions recorded increases in daily availability, mainly in the Central West, which changed from 87.1% (2018) to 94.9% (2019), thus recovering the level registered before the supply crisis in the Region in 2016 (94.7%).
Percentage (%) of housing units that use the general water supply system as their main supply source, by Major Region, with daily availability - 2019
Fonte: IBGE, Diretoria de Pesquisas, Coordenação de Trabalho e Rendimento,
Pesquisa Nacional por Amostra de Domicílios Contínua 2019.
In the North, less than one third of the housing units had access to the general sewer system
In 2019, a bathroom for exclusive use was present in 97.8% of the housing units in the country (70.8 million) and, in 68.3% (49.1 million) sewer was disposed by means of the public system or a septic tank linked to the system. The percentage of housing units with a bathroom for exclusive use in the housing unit ranged from 90.2%, in the North, to 99.8%, in the South.
The proportion of housing units with access to the general sewer system recorded significant differences among the Major Regions: the North (27.4%) and the Northeast (47.2%) had the lowest coverage, whereas the Southeast reached an estimated 88.9%; the South and Central West had figures of 68.7% and 60.0%, respectively. All the Regions recorded increase in comparison with 2018, mainly the North (from 21.8% to 27.4%) and the Central West (from 55.6% to 60.0%). Despite the lower estimate of access to the general system, the North also had the biggest expansion against 2016, when 18.9% of the housing units had that service.
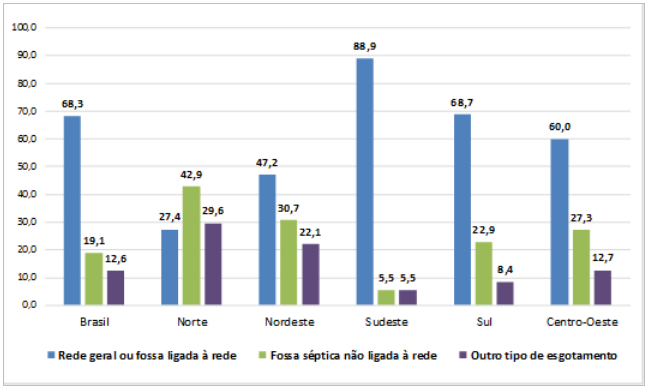
Except for the North, the other Major Regions had the general system as the predominant type of sewer disposal from housing units. The access to the general was direct or supply or by means of a septic tank linked to the system: in the first case, the Southeast had the biggest estimate (86.5%), whereas the septic tank linked to the system had the biggest percentage in the South Region (12.5%).
The septic tank not linked to the system reached 19.1% in the housing units in the country, with percentages of 42.9% and 30.7% in the North and Northeast, respectively. In the Southeast, that form was used by only 5.5% of the housing units.
Another form of sewer disposal was estimated at 12.6%, indicating that approximately nine million housing units in the country used rudimentary cesspits for sewer disposal, also the ditch, river, lake or sea and other forms of disposal. In the North, 29.6% of the housing units (1.6 million) were in that condition, surpassing the estimated percentage of housing units that had the general system as the main form (27.4%). The Northeast also registered a high percentage of that type of disposal (22.1% or 4.1 million), whereas in the Southeast, 5.5% of the housing units (1.7 million) disposed sewer that way.
Percent distribution (%) of housing units, by Major Region, by form of sewer disposal – 2019
Fonte: IBGE, Diretoria de Pesquisas, Coordenação de Trabalho e Rendimento,
Pesquisa Nacional por Amostra de Domicílios Contínua 2019.
Burning of garbage in the property reached 17.6% in the North and 15.1% in the Northeast
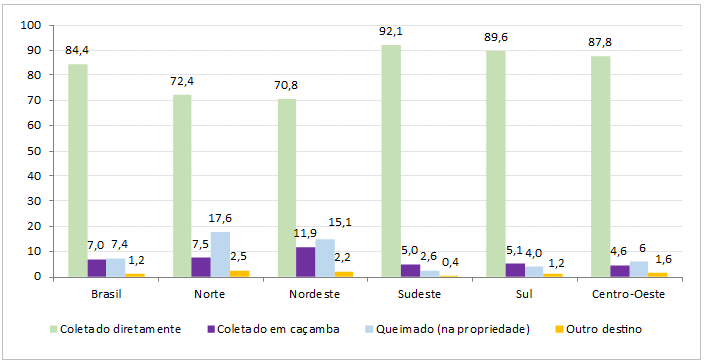
Garbage from housing units in Brazil is mainly disposed by means of direct collection performed by a sanitation company. Data from the survey show that this form, besides being the main one, has gradually increased: 82.7% in 2016, 82.9% in 2017, 83.0% in 2018 and in 2019 it reached its highest figure, 84.4%. In second place, there was collection by means of dumpsters from a sanitation service (7.0%), burning of garbage in the property (7.4%) and other destination (1.2%).
From 2018 to 2019, the expansion of 3.6% of direct garbage collection meant the increase of 2.1 million housing units with that type of service. All the Major Regions had an increase in direct collection: North (from 70.8% to 72.4%), Northeast (from 69.6% to 70.8%), Southeast (from 91.1% to 92.1%), South (from 87.3% to 89.6%) and Central West (from 85.7% to 87.8%). That movement was followed by the reduction of the participation of collection in dumpsters from a sanitation service in the Major Regions.
In spite of the increase of direct collection, in 2019 there were 5.4 million housing units in the country that burned garbage in the property. The biggest occurrences were in the North (17.6%) and Northeast (15.1%), which gathered 3.8 million housing units in this condition. The North Region kept in 2019 the same estimate as in 2018 (17.6%); whereas in the Northeast it recorded slight decrease before the percentage of 2018 (15.3%).
Other destination, besides the aforementioned ones, was used by 883 thousand units, being the biggest concentration in the North (137 thousand) and Northeast (412 thousand) Regions.
Percent distribution (%) of housing units, by type of garbage disposal, by Major Region - 2019
Fonte: IBGE, Diretoria de Pesquisas, Coordenação de Trabalho e Rendimento,
Pesquisa Nacional por Amostra de Domicílios Contínua 2019.
49.2% of the housing units had a car for personal use
Continuous PNAD also investigated the existence of some goods (refrigerator, washing machine, car and motorcycle). The ownership of a car for personal use was estimated at 49.2% of the housing units; in the case of motorcycles, the percentage decreased to 22.9% and only 11.7% housing units had both. The biggest figures for cars were those in the Southeast (56.4%), South (68.5%) and Central West (59.8%).
In the North and Northeast the estimate of housing units with a motorcycle were, respectively, 31.8% and 30.4%, bigger than the percentage of cars in the same Major Regions. The South (15.6%) and Central West (16.9%) had the biggest percentages of housing units with a car and a motorcycle.
Except for the North, the other Major Regions registered expansion of the proportion of both cars and motorcycles against 2018. Versus 2016, the Central West recorded the main increase in cars, with a change from 56.2% to 59.8%.
The refrigerator had the highest percentage of presence in housing units and all the Major Regions recorded estimates above 90.0% in 2019. With a much smaller coverage, the washing machine was found in 66.1% of the housing units with significant differences among the Major Regions: North (44.3%) and Northeast (37.0%) recorded the smallest percentages, whereas the Southeast (79.,1%), South (85.8%) and Central West (73.7%), the biggest. The Central West, which recorded an estimate of 67.0% in 2016, recorded the main increase among all the Major Regions.
Population above 30 years of age reached 57.7% in 2019
The distribution of the resident population by age group showed the trend to decrease of the proportion of persons below 30 years of age: in 2012 that estimate was 47.7%, having changed to 42.3% in 2019 – being a highlight the decrease of persons aged 10 to 13 (from 6.8% to 5.5%) and aged 14 to 17 (from 7.2% to 5.9%). The groups included persons aged 18 to 19, 20 to 24 and 25 to 29, which corresponded to, respectively, 3.2%, 7.6% and 7.3% of the resident population.
The population aged above 30 recorded an increase in 2019, reaching 57.7% – and estimate above that of 2012 (52.4%). The groups aged 30 to 39, 40 to 49, 50 to 59 and 60 to 64 corresponded to 15.8%, 13.8%, 12.4% and 4.9% of the resident population, respectively.
In 2019, men aged up to 24 years of age (17.8%) registered an estimate above that of women (17.2%) in the same age group. From age 25 on, the proportion of women was bigger than that of men in all the age groups, being 30.4% and 34,6%, the figures for men and women.
The North had the biggest population concentration in the youngest age groups, with 43.0% of the population in the Major Region aged under 24. In the Southeast and South Regions that indicator decreased to 32.3% and 32.6%, respectively, and the national average stayed at 35.0%. The population aged 60 and over was mostly concentrated in the Southeast (17.1%) and in the South (17.4%) and increased in all the Major Regions in comparison with 2012.
White population decreased in all the Major Regions
The self-declared white population, in 2019, amounted to 42.7% of the resident population, whereas the self-reported black and brown population was 9.4% corresponded to 46.8%. In 2012, those estimates were, respectively, 46.6% (white), 7.4% (black) and 45.3% (brown).
The Northeast Region (11.9%) had the biggest proportion of self-declared black population, followed by the Southeast (9.9%), Central West (9.2%) and North (7.3%). The brown population recorded the biggest figures in the North (72.2%) and Northeast (62.5%). The South Region had a predominantly white population (73.2%), whereas the North (19.1%) had the lowest estimate for that group.
The participation of the self-declared white population fell in all the Major Regions from 2012 to 2019, mainly in the Southeast (5.0 percentage points) and in the South (5.8 percentage points). In the Northeast Region there was the main increase of the participation of self-declared black persons (3.2 percentage points) and in the South of self-declared brown persons (4.8 percentage points).

