In 2018, life expectancy was of 76.3 years


November 28, 2019 10h00 AM | Last Updated: November 28, 2019 05h33 PM
A person born in Brazil in 2018 was expected to live, on average, up to 76.3 years. This represented an increase of three months and 4 days in relation to 2017. Life expectancy of men rose from 72.5 years in 2017 to 72.8 years in 2018, whereas that of women changed from 79.6 to 79.9 years.
The probability of a male newly-born in 2018 not completing the first year of life was 13.3 per thousand live births. For the female newly-born, the chance was of 11.4 girls not completing the first year of life.
The mortality in the childhood – of children below five years of age – dropped from 14.9 per thousand in 2017 to 14.4 per thousand in 2018. Of the children who died before completing 5 years of age, 85.5% had the chance to die in the first year of life and 14.5%, between 1 and 4 years of age. In 1940, the chance of dying between 1 and 4 years of age was of 30.9%, more than twice that registered in 2018.
Among the Federation Units, the highest life expectancy was found in Santa Catarina (79.7 years) and the lowest one, in Maranhão (71.1 years). An elderly person who completed 65 years in 2018 would have the highest life expectancy in Espírito Santo (20.4 years). On the other hand, a person who completed 65 years in Rondônia in 2018 would have the life expectancy of more 16.1 years. Taking into account the difference by sex, the male elderly population in Espírito Santo would live more 18.4 years, and the female one, 22.2 years. Elderly men in Piauí (with more 14.7 years) and women in Rondônia (with more 17.3 years) are among the lowest expectancies.
This information is available in the Complete Life Tables for Brazil - 2018, which includes life expectancies of exact ages up to 80 years. This information is used as one of the parameters to calculate the social security factor for retirement pensions under the General Social Security System. This edition brings comparisons with 1940, year in which a first phase of demographic transition was reported, characterized by the beginning of the drop in the mortality rates.
The support material of the Life Table is on the right side.
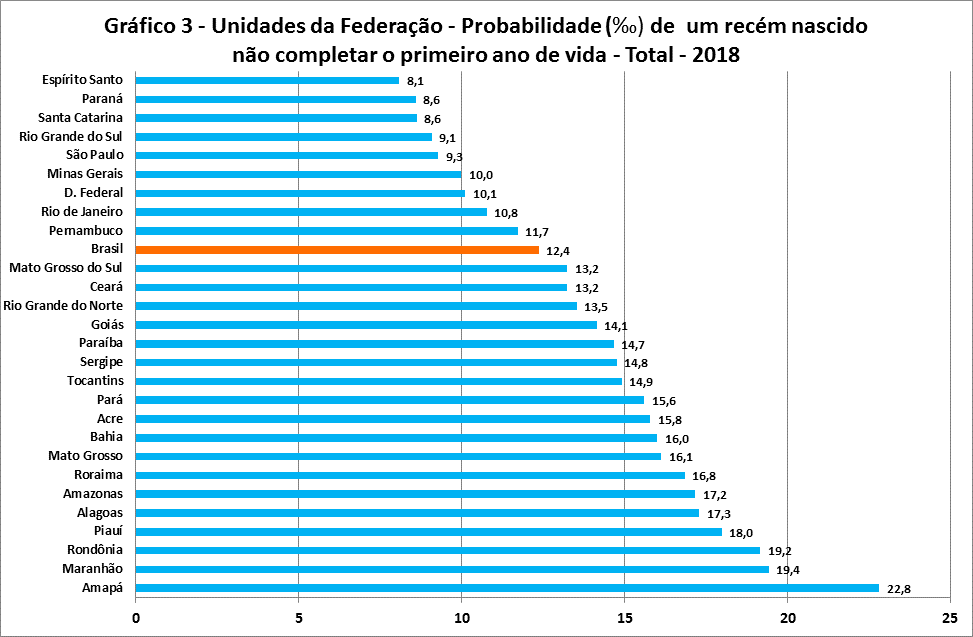
Infant mortality rate is 12.4 deaths per thousand births
Between 1940 and 2018, infant mortality declined by 91.6%, changing from 146.6 per thousand to 12.4 per thousand, and mortality between one and four years of age reduced by 97.2%, changing from 76.7 per thousand to 2.12 per thousand. Children in the age bracket between 0 and 5 years are very sensitive to the sanitary conditions, which were very precarious in the past. The distribution of deaths of children below 5 years of age complied with those in more developed regions, with the concentration of the deaths before their first year of life.
| Infant mortality rate (per thousand), mortality rate in the group between 1 and 4 year of age (per thousand) and mortality rate in childhood (per thousand) - Brazil - 1940/2018 | |||||
|---|---|---|---|---|---|
| Year | Infant mortality rate (per thousand) | Mortality rate in the group between 1 and 4 years of age (per thousand) | Mortality rate in the childhood (per thousand) | Of the children who died before 5 years of age, the chance to die (%) | |
| Before 1 year of age | Between 1 and 4 years of age | ||||
| 1940 | 146.6 | 76.7 | 212.1 | 69.1 | 30.9 |
| 1950 | 136.2 | 65.4 | 192.7 | 70.7 | 29.3 |
| 1960 | 117.7 | 47.6 | 159.6 | 73.7 | 26.3 |
| 1970 | 97.6 | 31.7 | 126.2 | 77.3 | 22.7 |
| 1980 | 69.1 | 16 | 84 | 82.3 | 17.7 |
| 1991 | 45.1 | 13.1 | 57.6 | 78.3 | 21.7 |
| 2000 | 29 | 6.7 | 35.5 | 81.7 | 18.3 |
| 2010 | 17.2 | 2.64 | 19.8 | 86.9 | 13.1 |
| 2018 | 12.4 | 2.12 | 14.4 | 85.5 | 14.5 |
| Δ% (1940/2018) | -91.6 | -97.2 | -93.2 | ||
| Δ (1940/2018) | -134.3 | -74.6 | -197.6 | ||
| Sources: 1940. 1950. 1960 e 1970 - Tábuas construídas no âmbito da Gerência de Estudos e Análises da Dinâmica Demográfica. 1980 e 1991 - ALBUQUERQUE. Fernando Roberto P. de C. e SENNA. Janaína R. Xavier “Tábuas de Mortalidade por Sexo e Grupos de Idade - Grandes e Unidades da Federação – 1980. 1991 e 2000. Textos para discussão. Diretoria de Pesquisas. IBGE. Rio de Janeiro. 2005.161p. ISSN 1518-675X; n. 20 2000 - IBGE/Diretoria de Pesquisas. Coordenação de População e Indicadores Sociais. Gerência de Estudos e Análises da Dinâmica Demográfica. Projeção da população do Brasil por sexo e idade para o período 2000-2060. 2010 em diante - IBGE/Diretoria de Pesquisas. Coordenação de População e Indicadores Sociais. Gerência de Estudos e Análises da Dinâmica Demográfica. Projeção da população do Brasil por sexo e idade para o período 2010-2060. |
|||||
Life expectancy increases 30.8 years between 1940 and 2018
In 1940, life expectancy was of 45.5 years, being 42.9 years for men and 48.3 years for women. Between 1940 and 1960, Brazil virtually reduced by half the gross mortality rate – number of deaths of a year divided by the population in July that same year –, dropping from 20.9 deaths per each thousand inhabitants to 9.8 per thousand. Life expectancy at birth was of 52.5 years in 1960. Altogether, life expectancy rose 30.8 years between 1940 and 2018, reaching 76.3 years.
In 1940, an individual had a life expectancy of 19.1 years when completing 50 years, living, on average, 69.1 years. With the decline of mortality in that period, the same 50-year individual in 2018 would have a life expectancy of 30.7 years, expecting to live, on average, up to 80.7 years, i.e., 11.6 years more than the individual with the same age in 1940.
| Life expectancy at birth - Brazil - 1940/2018 | ||||
|---|---|---|---|---|
| Year | Life expectancy at birth | Differences between sexes (years) | ||
| Total | Man | Woman | ||
| 1940 | 45.5 | 42.9 | 48.3 | 5.4 |
| 1950 | 48 | 45.3 | 50.8 | 5.5 |
| 1960 | 52.5 | 49.7 | 55.5 | 5.8 |
| 1970 | 57.6 | 54.6 | 60.8 | 6.2 |
| 1980 | 62.5 | 59.6 | 65.7 | 6.1 |
| 1991 | 66.9 | 63.2 | 70.9 | 7.7 |
| 2000 | 69.8 | 66 | 73.9 | 7.9 |
| 2010 | 73.9 | 70.2 | 77.6 | 7.4 |
| 2018 | 76.3 | 72.8 | 79.9 | 7.1 |
| Δ (1940/2018) | 30.8 | 29.9 | 31.6 | |
| Sources: 1940. 1950. 1960 e 1970 - Tábuas construídas no âmbito da Gerência de Estudos e Análises da Dinâmica Demográfica. 1980 e 1991 - ALBUQUERQUE. Fernando Roberto P. de C. e SENNA. Janaína R. Xavier “Tábuas de Mortalidade por Sexo e Grupos de Idade - Grandes e Unidades da Federação – 1980. 1991 e 2000. Textos para discussão. Diretoria de Pesquisas. IBGE. Rio de Janeiro. 2005.161p. ISSN 1518-675X; n. 20 2000 - IBGE/Diretoria de Pesquisas. Coordenação de População e Indicadores Sociais. Gerência de Estudos e Análises da Dinâmica Demográfica. Projeção da população do Brasil por sexo e idade para o período 2000-2060. 2010 em diante - IBGE/Diretoria de Pesquisas. Coordenação de População e Indicadores Sociais. Gerência de Estudos e Análises da Dinâmica Demográfica. Projeção da população do Brasil por sexo e idade para o período 2010-2060. |
||||
20-year old men have 4.5 more chance of not completing 25 years than women
In 2018, a 20-year old man had 4.5 times more chance of not completing 25 years than a woman in the same age bracket. This phenomenon could be explained by the higher incidence of deaths due to external or non-natural causes, which mostly hits the male population. In 1940, the phenomenon of male excess mortality – bigger mortality of the male population in relation to the female one – was not registered in Brazil, which shows that is related with the urbanization and metropolization of Brazil.
From 1980 onwards, the deaths associated with external or non-natural causes, which include homicides, suicides, traffic accidents, drownings, accidental falls, etc., happened to perform a prominent role, though negative, on the structure by age of the mortality rates, particularly those of male young adults.
Between 1940 and 2018, the female mortality also decreased within the fertile period (between 15 and 49 years of age). In 1940, from each hundred thousand live births, 77,777 began the reproductive period and, among them, 57,336 completed it. As for 2018, from each hundred thousand live births, 98,467 reached 15 years of age and, among them, 94,483 completed it. In other words, the probability of a female newly-born completing the fertile period in 1940, which was 573‰, changed to 945‰ in 2018.
The adult phase, considered here as the period between 15 and 60 years of age, also benefited from the decline in the mortality levels. In 1940, from each thousand persons who reached 15 years of age, nearly 535 of them completed 60 years of age. In 2018, in turn, of those same thousand persons, 865 completed 60 years of age.
Life expectancy of elderly persons increases by 8.2 years between 1940 and 2018
In 1940, from each thousand persons who reached 65 years of age, 259 would reach 80 years and over. In 2018, from each thousand elderly persons aged 65 years, 637 would complete 80 years. Life expectancies when reaching 80 years were of 10.4 years for women and 8.6 years for men in 2018. In 1940, those values were of 4.5 years for women and 4.0 years for men.
| Life expectancy at 65 years - Brazil - 1940/2018 | ||||
|---|---|---|---|---|
| Year | Life expectancy at 65 years | Differential (years) (W-M) | ||
| Total | Man | Woman | ||
| 1940 | 10.6 | 9.3 | 11.5 | 2.2 |
| 1950 | 10.8 | 9.6 | 11.8 | 2.2 |
| 1960 | 11.4 | 10.1 | 12.5 | 2.4 |
| 1970 | 12.1 | 10.7 | 13.4 | 2.6 |
| 1980 | 13.1 | 12.2 | 14.1 | 1.9 |
| 1991 | 15.4 | 14.3 | 16.4 | 2 |
| 2000 | 15.8 | 14.2 | 17.2 | 2.9 |
| 2010 | 17.6 | 16 | 19 | 3 |
| 2018 | 18.8 | 17.1 | 20.3 | 3.2 |
| Δ (1940/2018) | 8.2 | 7.8 | 8.8 | |
| Sources: 1940. 1950. 1960 e 1970 - Tábuas construídas no âmbito da Gerência de Estudos e Análises da Dinâmica Demográfica. 1980 e 1991 - ALBUQUERQUE. Fernando Roberto P. de C. e SENNA. Janaína R. Xavier “Tábuas de Mortalidade por Sexo e Grupos de Idade - Grandes e Unidades da Federação – 1980. 1991 e 2000. Textos para discussão. Diretoria de Pesquisas. IBGE. Rio de Janeiro. 2005.161p. ISSN 1518-675X; n. 20 2000 - IBGE/Diretoria de Pesquisas. Coordenação de População e Indicadores Sociais. Gerência de Estudos e Análises da Dinâmica Demográfica. Projeção da população do Brasil por sexo e idade para o período 2000-2060. 2010 em diante - IBGE/Diretoria de Pesquisas. Coordenação de População e Indicadores Sociais. Gerência de Estudos e Análises da Dinâmica Demográfica. Projeção da população do Brasil por sexo e idade para o período 2010-2060. |
||||
Among the Federation Units, the lowest infant mortality rate was found in Espírito Santo in 2018, 8.1 deaths for each thousand live births. The highest one took place in Amapá (22.8 per thousand).
Compared with the Brics countries in the 2015-2020 period, the infant mortality rate in Brazil was closer to that of China (9.9‰), above Russia (5.8‰) and quite below India and South Africa (32.0‰ and 27.2‰, respectively). Even the lowest rate in Brazil (8.1‰, in Espírito Santo) was far from the rates of developed countries like Japan and Finland (1.8‰ and 1.7‰, respectively, in the same period).
The highest life expectancy at birth among the Federation Units was in Santa Catarina, 79.7 years, followed by Espírito Santo, São Paulo, the Federal District and Rio Grande do Sul, all of them recording values equal to or higher than 78 years. The lowest life expectancies were found in Maranhão (71.1 years), Piauí (71.4) and Rondônia (71.7).
Considering the difference between life expectancies by sex in the states, a female newly-born in the state of Santa Catarina would expect to live, on average, 15.8 years more than a male newly-born in Piauí. Although the male mortality was always higher than the female one, life expectancy of men in Santa Catarina (76.4 years) was higher than that of women in the states of Roraima (74.8 years), Maranhão (75.1 years), Rondônia (75.3 years), Piauí (75.8 years) and Amazonas (76.0 years).
An elderly person who completed 65 years in 2018 would have the highest life expectancy in Espírito Santo (20.4 years), i.e., he/she would live, on average, 85.4 years. On the other hand, a person who completed 65 years in Rondônia in 2018 would have the life expectancy of more 16.1 years. Taking into account the difference by sex, the male elderly population in Espírito Santo would live, on average, 83.4 years, and the female one, 87.2 years. Elderly men in Piauí (with more 14.7 years) and women in Rondônia (with more 17.3 years) are among the lowest expectancies.
Probability of survival between 60 and 80 years increases by 74%
The decrease of the mortality in the older ages made the probabilities of survival between 60 and 80 years of age significantly increase between 1980 and 2018 in all the Federation Units, even more than doubling the survival chances between these two ages in some cases. In 1980, from each thousand persons that reached 60 years, 344 reached 80 years of age. In 2018, that value changed to 599 individuals.
In terms of differences by region and by sex in 2018, the highest probabilities of survival between 60 and 80 years of age for both sexes were met in the state of Espírito Santo, 576 and 719 per thousand for men and women, respectively. The lowest probabilities were found in the states of Piauí for men (425 per thousand), in Roraima (552 per thousand) for women and, for both sexes, in Rondônia, where each thousand individuals who reached 60 years, 492 completed 80 years of age.


