11.8% of the youths with lowest earnings dropped out of school school before completing basic education in 2018
November 06, 2019 10h00 AM | Last Updated: November 11, 2019 07h19 PM
In 2018, about 11.8% of the teenagers aged 15 to 17 years of age who were in the 20% of the population with the lowest earnings dropped out of school without completing basic education, a percentage 8 times above that of the same age group considering the 20% highest earnings (1.4%). These data come from the IBGE's Summary of Social indicators (SIS).
About 40.0% of the Brazilian population aged 25 and over had no schooling or even completed primary school. Considering illiteracy among persons 15 year of age and over, Brazil has the fifth biggest rate (8.0%) among 16 in Lain America, according to Unesco. Besides, 49.0% of the Brazilians aged 25 to 64 years of age had not finished high school, twice as the number of countries analyzed by OECD regarding this topic (21.8%).
In 2018, the percentage of white youths in higher education or who had completed their higher education studies (36.1%) was still almost twice as that of blacks and browns (18.3%). With regard to OECD member countries, Brazil has the lowest starting wage for primary and high school teachers. And one out of every four municipalities did not have a municipal law-based wage floor established for teachers.
From 2017 to 2018, there was a decrease from 26.0% to 25.3% in the percentage of the population below poverty line , which is equivalent to 1.1 million persons no longer in that status, considering the line adopted by the World Bank: earnings below US$ 5.50 PPC (Purchasing Power Parity) per day. The 25.3% of the Brazilian population below that line in 2018 amounted to 52.5 million persons.
In 2018, the proportion of persons between the World Bank's poverty line (with earnings below US$ 1.90 PPC per day), remained at the highest level of the Continuous PNAD series, initiated in 2012: 6.5% of the Brazilian population, or 13.5 million persons.
In 2018, about 72.7% of the persons below poverty line (US$ 5.50 PPC / day)were black or brown. The average household earnings of black or brown persons (R$ 934) was alsmost half as that of white persons (R$ 1,846); such inequality has remained throughout the time series.
Poverty also implies reduced access to basic services: 56.2% of the persons below poverty line (US$ 5,50 PPC / day) lived in housing units without sewage disposal, whereas the average population without that kind of service amounted to 37.2%.
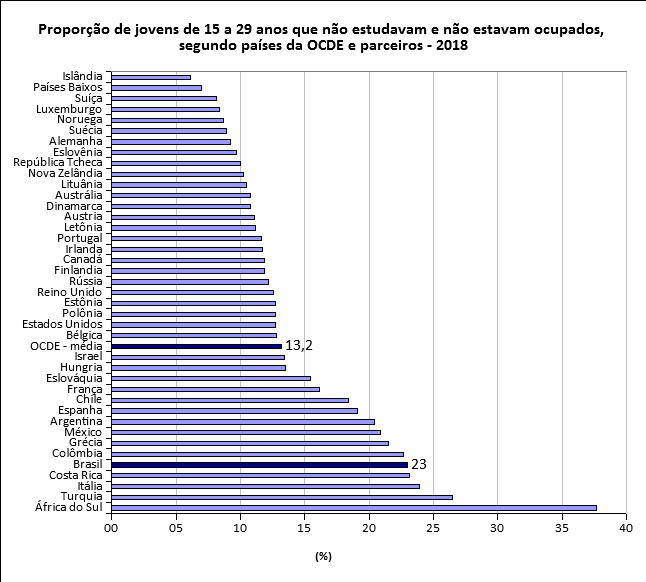
SIS shows that the country has approximately 10.9 million youths (aged 15 to 29) who were not studying or employed, a total 23% of the persons in that age group. That percentage places Brazil in the fifth worst position among 41 countries analyzed by the annual OECD reports, the average of which is 13.2% for this indicator.
In 2018, the unemployment rate of the black or brow population was 14.1%, versus 9.5% for the white population. Among the employed white population, 34.6% performed informal activities, whereas that percentage rose to 47.3% for blacks or browns in the same condition.
In 2018, black or brown persons amounted to 53.7% of the employed persons, but 66% of the time-related underemployed persons.
Regarding earnings from work, the 10% with the highest earnings received 13 times the average earnings of the 40% of the employed population with lowest earnings. Such differences were most significant in Piauí (18 times) and was 10 times smaller in Santa Catarina, Goiás, Alagoas and Mato Grosso. The support material for SIS 2018 is available on the right of the page.
From 2017 to 2018, percentage of persons in poverty fell from 26.0% to 25.3%
In 2018, considering indicators from the World Bank, 25.3% of the Brazilian population had earnings below US$ 5.50 PPC (Purchasing Power Parity) per day, which is equivalent to R$ 420,00 per month. That percentage amounts to about 52.5 million persons, and remained below that poverty line, a group in which 72.7% were black or brown. From 2017 to 2018, as shown in the time series below, there was a decrease of 0.7 percentage points in the percentage of persons below poverty line, which means 1.1 million persons out of that condition.
|
Persons, by ranges of per capita household earnings - Brazil - 2012 to 2018 ( % and 1 000 persons) |
||||||||||
|---|---|---|---|---|---|---|---|---|---|---|
| Brazil | Total (1 000 persons) |
Proportion of persons by ranges of household per capita household earnings (%) | Value of 50% of the median in per capita household earnings (2) | |||||||
| Less than US$ 1.9 PPC 2011 (1) | Less than US$ 3.2 PPC 2011 (1) | Less than US$ 5.5 PPC 2011 (1) | Up to 50% national median (2) | |||||||
| Absolute | Percentage | Absolute | Percentage | Absolute | Percentage | Absolute | Percentage | Absolute | ||
| 2018 | 207,743 | 6.5 | 13,537 | 12.4 | 25.721 | 25,3 | 52.523 | 24,2 | 50.227 | 402 |
| 2017 | 206,089 | 6.4 | 13,268 | 12.3 | 25.374 | 26,0 | 53.589 | 23,6 | 48.539 | 375 |
| 2016 | 204,407 | 5.8 | 11,929 | 12.1 | 24.767 | 25,5 | 52.153 | 23,3 | 47.724 | 363 |
| 2015 | 202,727 | 4.9 | 9,918 | 10.7 | 21.758 | 23,7 | 48.032 | 22,7 | 45.998 | 347 |
| 2014 | 200,963 | 4.5 | 9,033 | 9.9 | 19.828 | 22,8 | 45.817 | 22,4 | 45.101 | 327 |
| 2013 | 199,249 | 5.1 | 10,153 | 11.4 | 22.665 | 24,9 | 49.586 | 22,9 | 45.597 | 293 |
| 2012 | 197,529 | 5.8 | 11,379 | 12.2 | 24.158 | 26,5 | 52.262 | 23,1 | 45.590 | 261 |
| Source: IBGE. Pesquisa Nacional por Amostra de Domicílios Contínua, 2012 a 2018, consolidado de primeiras entrevistas. Notes: Except persons whose status in the household was a pensionercondição no domicílio era pensionista, empregado doméstico ou parente do empregado doméstico. Rendimentos deflacionados para reais médios do próprio ano. (1) Taxa de conversão da paridade de poder de compra para consumo . (2) Mediana calculada no nível pessoa.privado, R$ 1,66 para US$ 1,00 PPC 2011, valores diários tornados mensais e inflacionados pelo IPCA para anos recentes. | ||||||||||
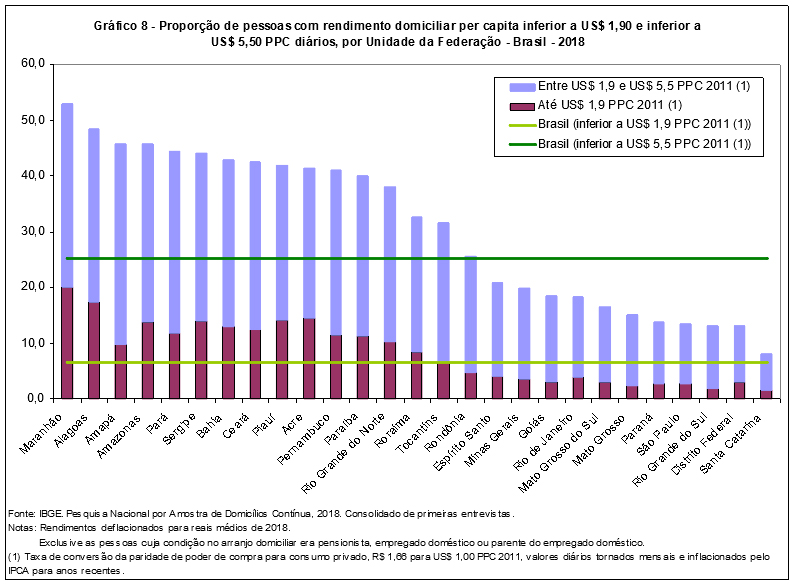
The reduction of poverty observed in 2018 was concentrated in the Southeast (about 700 thousand persons). Almost half (47.0%) of the Brazilians below poverty line in 2018 were in the Northeast. Maranhão had the biggest percentage of persons below poverty line (53.0%) and Santa Catarina, the smallest (8.0%). The percentages of poverty in all the states of the North and Northeast surpassed the national average (graph below).
Extreme poverty reaches biggest percentage since 2012: 6.5% of the population
In 2018, the proportion of persons with per capita household earnings below US$ 1.90 PPC (extreme poverty line, according to the World Bank, equivalent to R$ 145 per month) remained at the highest level in the last seven months analyzed: 6.5% of the Brazilian population. That percentage corresponds to 13.5 million persons, more than the total population of countries such as Bolivia, Belgium, Cuba, Greece and Portugal. Between 2017 and 2018, there was stability in the proportion of persons with earnings below US$ 1.90 PPC.
Throughout the PNAD time series, the indicator changed between 2012 and 2014, with a decrease by 1.3 percentage points in the proportion of persons with earnings below US$ 1.90 PPC, which reached 4.5%. Between 2014 and 2018, however, there was an increase in the proportion (2.0 percentage points).
Per capita household earnings of white persons were twice as that of black or brown persons
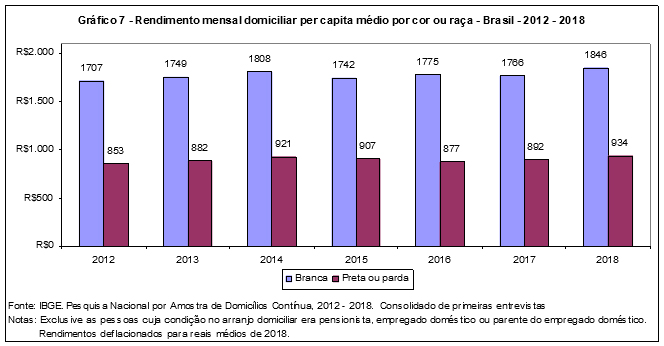
In 2018, the average per capita monthly household earnings of blacks or browns (R$ 934) was almost half of the earnings of white persons (R$ 1,846). Between 2012 and 2018, there was slight decrease of that difference which did not overcome the historical inequality in earnings.
56% of the population below poverty line did not have access to sewage disposal
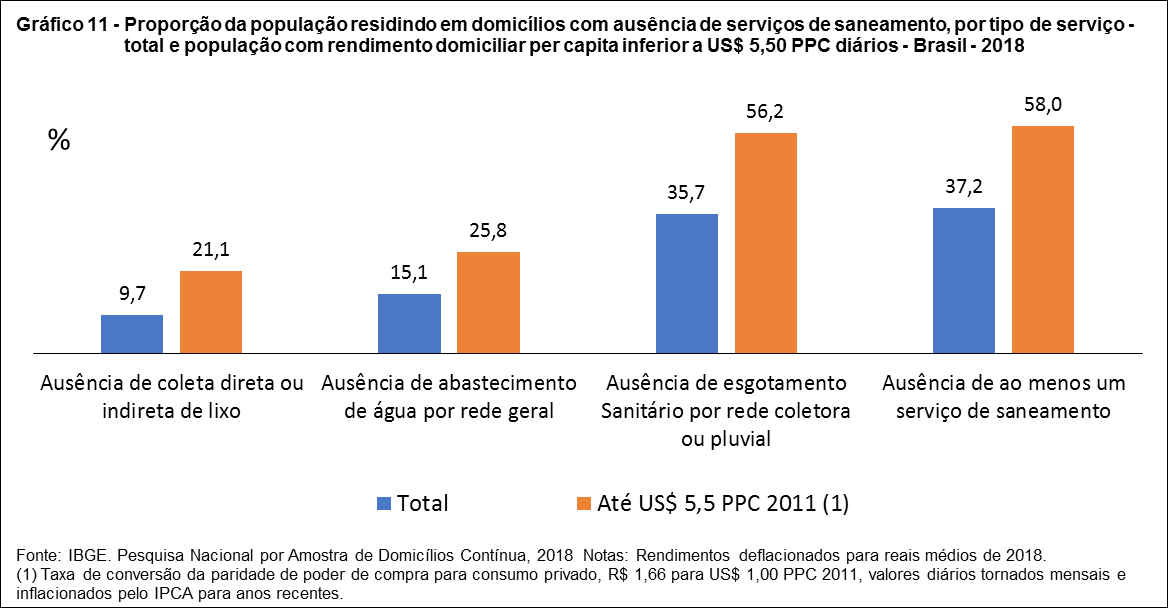
In 2018, about 9.7% of the population lived in housing units without garbage collection; 15.1% did not have water supply from a general system; 35.7% did not have access to the sewage disposal. The percentages among the population below poverty line (with per capita household earnings below US$ 5.50 PPC) were significantly higher: 21.1% lived in housing units without garbage collection, 25.8% did not have water supply from a general system and 56.2% lived in housing units without sewage disposal.
40% of the population aged 25 and over did not finish primary school
The IBGE's Continuous PNAD shows that 40.0% of the Brazilian population aged 25 and over in did not have any schooling or had even finished primary school, in 2018, whereas 12.6% had complete primary school and incomplete primary school, 30.9% had complete high school and incomplete higher education and 16.5% had complete higher education.
There has been considerable increase in the level of schooling of the Brazilian population throughout recent generations , but that was not enough to place Brazil close to international patterns. Among 16 Latin American countries analyzed whose data were released by Unesco, the illiteracy rate of the population aged 15 and over ranged from 0.2% (Cuba) to 18.7% (Guatemala) in 2015. In this group, Brazil (8.0%) is among the five countries with the highest illiteracy rates, after Bolívia (7.5%) and together with the Dominican Republic (8.0%).
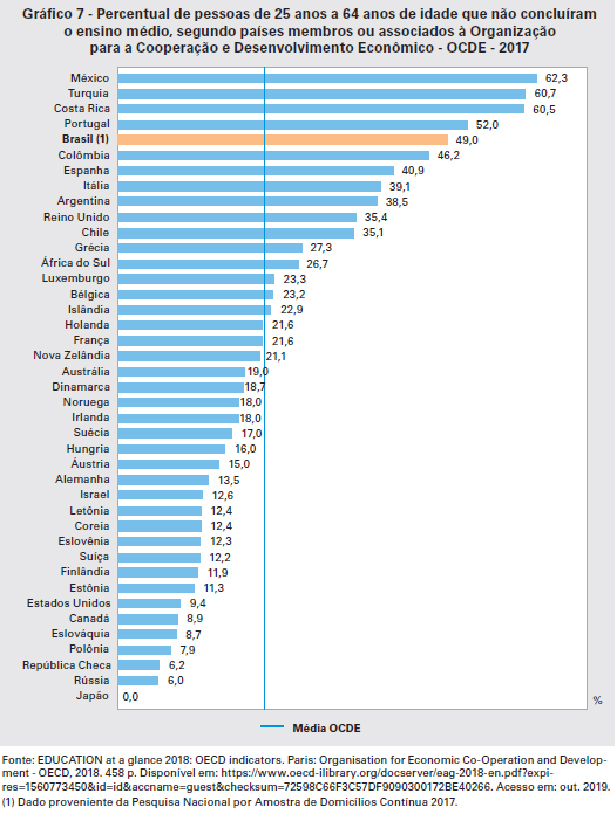
Besides, among OECD member countries, the average percentage for persons aged 25 to 64 who had not finished high school was 21.8%. In Brazil, that same rate more than doubled: 49.0% (graph below).
Brazil did not meet PNE targets for adequacy of age to school level
In 2018, the Adjusted Net School Attendance Rate (proportion of persons who attend or finished the adequate school level according to their age) from the 1st to the 5th grade was 96.1%; from the 6th to the 9th grade, 86.7%; and for high school, 69.3%. These figures show that we have not yet met targets 2 and 3 of the National Education Plan: 100% for primary school and 85% for high school.
School delay by stages is more significant in the group aged 15 to 17 (23.1%), followed by the groups aged 11 to 14 (12.4%) and 18 to 24 (25.2%). School dropout without conclusion of the adequate level affects more significantly those aged 18 to 24 (63.8%).
11.8% of the youths with the lowest earnings dropped out of school without finishing basic education
In 2018, school failure relative to attendance to high school of youths aged 15 to 17 years of age was four times bigger among the 20% of the population with the lowest earnings (33.6%), than in the 20% with the highest earnings (8.6%).
Besides, 11.8% of the youths in that age bracket among the 20% with the lowest earnings had dropped out of school without finishing basic education. That percentage was 8 times bigger than that of youths in the 20% with the highest earnings (1.4%).
School failure in relation to higher education affected 11.0% of the population aged 18 to 24, or 2.5 million youths. From that total, 83.2% attended high school and 16.8%, elementary school.
Percentage of white persons attending higher education was twice as that of blacks or browns
About 18.3% of the black or brown youths age 18 to 24 attended higher education or had finished that level. Among white persons in the same age group, the percentage was twice as high: 36.1%.
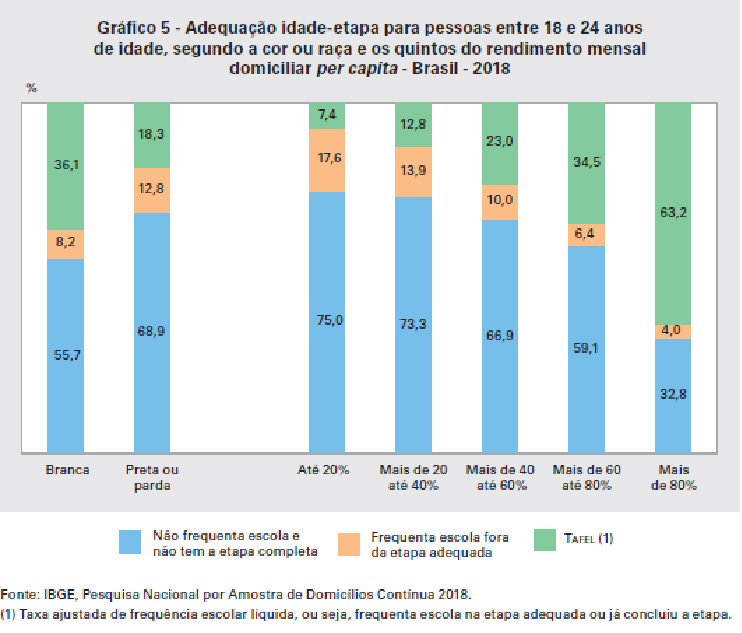
Considering the five fifths of the population by order of earnings, inequality is clear: whereas 63.2% of the youths aged 18 to 24 in the wealthier fifth were attending higher education of had finished that level, only 7.4% of the youths in the poorer fifth shared that same condition.
Brazil had 10.9 million youths who were not studying or employed
About 10.9 million youths aged 15 to 29 in the country were not studying or employed in 2018, which was equivalent to 23.0% of the persons in that age group. That places Brazil among the five worst positions considering 41 countries that had their results released by the report Education at a Glance 2019, conceived by the OECD.
The greatest incidence of youths not studying or working was found in the fifth of the population with the lowest per capita household earnings. A total 42.3% of the youths in this group were in such a situation.
Women prevailed among youths who were not studying or employed
Although women had a better level of schooling, there was a bigger proportion of young women (28.4%) than men (17.6%) who were not studying or employed in 2018. A worse situation was observed among black or brown women, who had twice as many chances of not being studying or working than white men.
60.3% of the youths who were not studying or working were out of the workforce
In 2018, more than half (60.3%) of the youths aged 15 to 29, who were not studying or employed, had not looked for a job and/or did not want to or were unavailable to start working.
Among those not looking for a job, but who would like to find work, the main reasons reported in the Continuous PNAD interviews were: the lack of work ion the locality (39.6%), not finding and adequate position (10.7%), not having personal experience or qualification (6.1%) or being considered too young to work (1.0%). Considering these figures, it is observed that 57.4% of these youths were discouraged.
White persons earned 73.9% more than blacks or browns
In 2018, white persons earned, on the average, 73.9% more than black or brown persons. Such inequality remains even in the case of compensation per hours worked.
In 2018, the earnings per hour of the white employed population (R$ 17.00) was 45% higher that that of the black or brown population( R$ 10.10). The biggest difference in compensation per hour was found among workers with complete higher education: R$ 32.8 for whites and R$ 22.7 for black or brown ones.
Unemployment and informality are highest among blacks or browns
In 2018, the unemployment rate of the black or brown population was 14.1%, versus 9.5% for the white population. In the time series, that rate remains higher for the black or brown population, having reached the biggest difference in 2017 (4.6 percentage points). That difference remained the same in 2018.
Among white workers, 34.6% had an informal work, whereas among black or brown ones, 47.3% were in informal work.
Besides, the presence of blacks or browns is more often observed in activities with the smallest earnings: Agriculture (60.8%), Construction (62.6%) and Domestic services (65.1%). White persons were the majority in better paid groups, such as Information, financial and other professional activities and public administration, education, health and social services.
Black or brown persons represented two thirds of the unemployed
black or brown persons represented, in 2018, 53.7% of the unemployed, but 66% of the time-related underemployed ones. Women were 43.7% of the employed population, but 54.6% of the underemployed population.
Youths aged 14 to 29 were 25.7% of the employed and 34.5% of the underemployed. As for the level of schooling, workers without instruction or with incomplete primary school were 26.2% of the first group, but 36.3% of the second one.
The 10% who earned more received 13 times the earnings of the 40% earning less. In 2018, considering the average earnings from work, the difference between the payment of the 10% of the employed population earning more and the 40% earning less reached its highest level: 13 times more.
That also resulted from the fact that, in 2018, the occupations with the highest earnings had gains above inflation, differently from the earnings of persons in the base of the distribution.
The Federation Units with the biggest differences were Piauí (above 18 times), Paraíba and Sergipe (about 16 times) and the smallest ones were in Santa Catarina, Goiás, Alagoas and Mato Grosso (all of them below 10 times), in 2018.
One out of every four municipalities did not have a wage floor for teachers
According to data from the education section in the Survey of Basic Municipal Information (MUNIC 2018), almost all the municipalities in the country (95,7%) had approved the creation of career plan for public teaching positions. Nevertheless, one out of every four municipalities (25.8%) had not defined the wage bill for that career by means of a municipal law, not following what is stated in Law no. 11.738/2008.
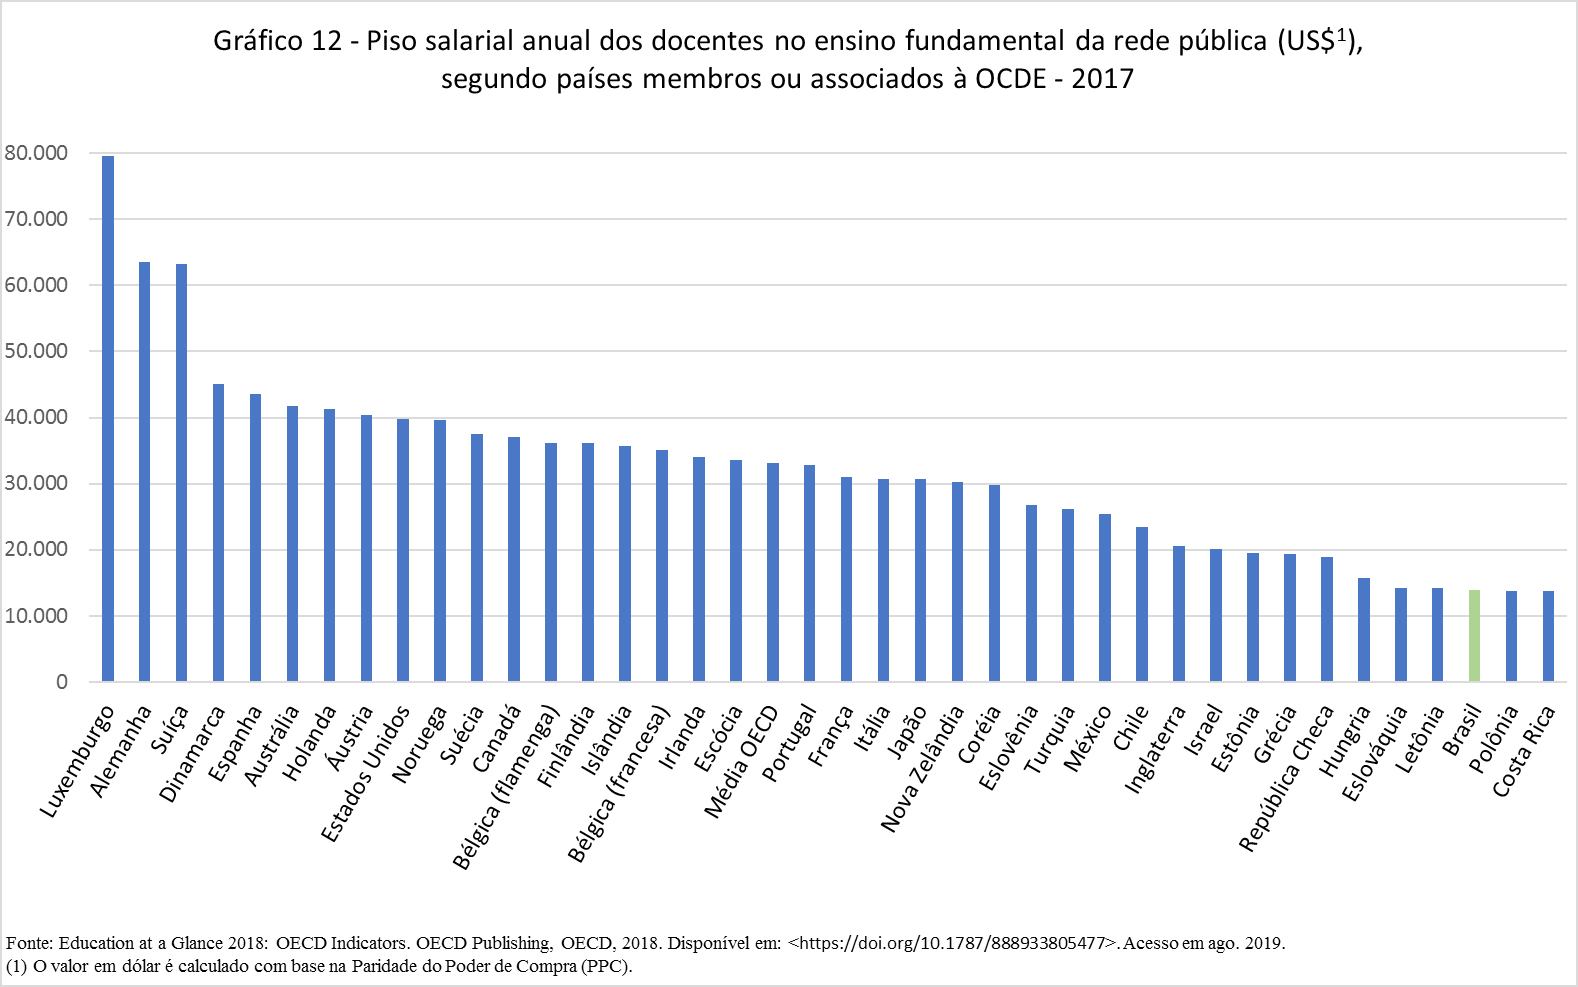
According to the report Education at a Glance 2018, Brazil is a country with the lowest starting salary paid to teachers of primary and high school, in relation to OECD countries, which have an average of US$ 34,534 PPC for high school.
Brazil paid, in 2017, a starting salary of US$ 13,971 PPC per year to teachers in basic education, whereas in Chile, for example, that wage floor amounted to US$ 23,429 per year at primary school (graph 12, below).
Only 38.8% of the municipalities has a career plan for school employees
Also according to MUNIC 2018, it is surprising to see the small proportion of municipalities (38.8%) with a career plan in effect for school professionals other than teachers, that is, professional engaged in services and administrative support, who are also part of the teaching process.
Among the Federation Units, the five lowest percentages of municipalities with a career plan for education professionals were found in Amapá (12.5%), Paraíba (14.8%), Ceará (15.2%), Goiás (22.4%), Rio Grande do Norte (23.4%) and Maranhão (27.2%).

