PAS 2016: services sector generates revenue of R$1.5 trillion


August 24, 2018 10h00 AM | Last Updated: August 28, 2018 05h16 PM
In 2016, the services sector was made of 1.311 million enterprises that generated R$1.5 trillion of net operating revenue and R$871.7 billion of gross value added.
The sector employed 12.3 million persons, who earned R$327.0 billion of salaries, withdrawals and other compensation.
The segment of Transportation, support activities for transportation and mailing concentrated the biggest share of the net operating revenue (28.3%). On an activity basis, technical-professional services led the generation of revenue (11.1%).
The average employment of the services sector was of 9 persons per enterprise. Transportation , support activities for transportation and mailing concentrated the largest enterprises (13 employed persons per enterprise on average) The segments real estate activities and maintenance and repair services registered the lowest average (four employed persons per enterprise).
The average monthly salary stood at R$2,048. The enterprises in the sector of information and communication had the highest salary average (R$4,119) and the services rendered mainly to families, the lowest one (R$1,288). Professional, administrative and complementary services concentrated the greatest share of employed persons (39.9%) and of wage bill (35.8%).
Information such as this is available in the Annual Survey of Services - PAS 2016, which analyses the producing structure of the sector of non-financial services in Brazil.
The publication and support material of the survey are on the right side of this page.
Transportation, support activities for transportation and mailing concentrate the greatest share of revenue (28.3%) in 2016
In 2016, Transportation, support activities for transportation and mailing registered the highest concentration of net operating revenue in the services sector (28.3%), against 29.3% in 2015 and 28.7% in 2007. Professional, administrative and complementary services ranked in the second position, accounting for 27.8%, against 26.8% in 2015 and 23.0% in 2007. Having accounted for the biggest share of the net operating revenue in 2007 (31.3%), the segment of Information and communication services ranked in the third position in 2016 (22.5%), remaining in the same position as in 2015 (22.9%). Altogether, these three segments accounted for 78.6% of the net operating revenue of the enterprises in the services sector in 2016, against 83.0% in 2007 and 78.9% in 2015.
In terms of value added, professional, administrative and complementary services remained as the main segment in 2016 (34.4%), with increased participation in relation to 2015 (34.0%) and 2007 (30.3%). The segment of Transportation and support activities for transportation ranked in the second position (24.4%), against 24.2% in 2007 and 24.7% in 2015. Having ranked in the fist position in 2007 (27.2%), information and communication services moved to the third position in 2015 (19.2%) and remained in this position in 2016 (19.3%).
Professional, administrative and complementary services concentrate 39.9% of employed persons and 35.8% of wage bill in 2016
Professional, administrative and complementary services remained with the greatest share of employed persons. In 2016, 39.9% of the employed persons belonged to this segment, below the rates of 40.2% recorded in 2007 and 40.0% in 2015. Services rendered to families ranked in the second position (22.6%), the same participation as in 2015 (22.6%), against 21.0% in 2007. In the third position, transportation, support activities for transportation and mailing represented 20.4% of the employed persons, against 21.3% in 2007 and 20.5% in 2015.
Concerning the wage bill, professional, administrative and complementary services remained with the greatest share (35.8% in 2016, against 34.0% in 2007 and 36.0% in 2015), followed by transportation, support activities for transportation and mailing (25.2% in 2016, against 26.5% in 2007 and 25.2% in 2015) and information and communication services (16.5% in 2016, against 16.6% in 2015 and 17.9% in 2007).
Average wage in services sector is R$2,048 in 2016
The average number of persons employed per enterprise changed from 10 in 2015 to 9 in 2016. In 2007, the index was 11. The activity of Transportation, support activities for transportation and mailing concentrated the largest enterprises in 2016, with 13 persons employed per enterprise. The segments of real estate activities and maintenance and repair services registered the lowest average, both with 4 persons employed per enterprise.
In 2016, the average monthly wage was R$2,048. The enterprises in the sector of information and communication had the highest average wage (R$4,119) and the services rendered mainly to families, the lowest one (R$1,288). All the activities posted an increase in the average wage in relation to 2007, though real estate activities was the only segment whose average wage stood below that registered in 2007 (R$1,780 in 2007 against R$1,641 in 2016).
The concentration ratio of order 12 (R12) changed from 18.9% (2007) to 12.3% (2016), indicating that the services sector has become less concentrated, with the 12 larger enterprises of PAS losing participation in the total net operating revenue of the sector.
A value of R12 higher than 75% indicates that the market structure is very concentrated; a value between 50% and 75% indicates that the market is concentrated; between 25% and 50%, slightly concentrated; and below 25%, non-concentrated
In the period under analysis, only the segment of information and communication services did not show a non-concentrated market structure. In 2007, the 12 largest enterprises of information services accounted for 54.0% of the segment revenue, characterizing it as a concentrated sector. In 2016, the concentration ratio decreased to 44.7%, characterizing the sector as slightly concentrated.
|
Average number of persons employed per enterprise, average monthly wage and concentration ratio of order 8, according to the segments of non-financial services - Brazil - 2007/2016 |
||||||
|
Segments of non-financial services |
Average number of persons |
Average monthly wage |
Concentration ratio of order 12 (%) (2) |
|||
|
2007 |
2016 |
2007 |
2016 |
2007 |
2016 |
|
|
Total |
11 |
9 |
1 742 |
2 048 |
18.9 |
12.3 |
|
Services rendered mainly to families (3) |
7 |
7 |
1 022 |
1 288 |
11.7 |
9.0 |
|
Information and communication services |
10 |
10 |
3 884 |
4 119 |
54.0 |
44.7 |
|
Professional, administrative and complementary services |
14 |
12 |
1 473 |
1 833 |
9.6 |
8.3 |
|
Transportation, support activities for transportation and mailing |
17 |
13 |
2 175 |
2 509 |
21.7 |
19.0 |
|
Real estate activities |
6 |
4 |
1 780 |
1 641 |
11.8 |
12.6 |
|
Maintenance and repair services |
4 |
4 |
1 192 |
1 458 |
14.4 |
11.0 |
|
Other service activities (4) |
16 |
11 |
2 073 |
2 629 |
13.2 |
19.7 |
|
Source: IBGE, Diretoria de Pesquisas, Coordenação de Serviços e Comércio, Pesquisa Anual de Serviços 2007/2016. |
||||||
|
(1) Values calculated from the division of wages, withdrawals and other compensation by the total number of persons employed in the enterprises. The result of this division was divided by 13, relative to the 12 monthly wages plus the Christmas bonus. The 2007 value was updated by the cumulative index of annual average change of the INPC between 2007 and 2016.(2) Value calculated from the participation of the 12 largest enterprises in the net operating revenue.(3) The concept adopted by PAS is less extensive than that in National Accounts. (4) This group gathers those activities not included in the other segments, such as: support services for agriculture, livestock farming and forestry; support service of funding, insurance and complementary social security; and services of sewage, collection, residues and material recovery. |
||||||
Technical professional services is activity with highest revenue in 2016
In the analysis by activity, technical professional services – which include consulting services, offices of law, accounting, publicity, firms of engineering, architecture, etc. – ranked in the first position in the generation of net operating revenue in the total PAS (11.2% in 2016, against 10.5% in 2015 and 9.9% in 2007).
It was followed by the activities of telecommunications (10.9% in 2016 against 11.3% in 2015 and 18.9% in 2007) and enterprises of road transportation of cargo (9.8% in 2016 against 10.5% in 2015 and 9.7% in 2007). Among the other activities, food services stood out in relation to 2007, recording the highest gain of share (2.2 p.p.), changing from the sixth position in 2007 to the fourth one in 2016 (7.7%).
|
Ranking of the net operating revenue of the total PAS, according to the activities of the services segments - Brazil - 2007/2016 |
||||
|
Activities |
Ranking of net operating revenue |
|||
|
2007 |
2016 |
|||
|
Share (%) |
Position |
Share (%) |
Position |
|
|
Technical-professional services |
9.9% |
2nd |
11.2% |
1st |
|
Telecommunications |
18.9% |
1st |
10.9% |
2nd |
|
Road transportation of cargo |
9.7% |
3rd |
9.8% |
3rd |
|
Food services |
5.5% |
6th |
7.7% |
4th |
|
Information technology |
6.5% |
4th |
7.4% |
5th |
|
Storage and support activities for transportation |
5.4% |
7th |
6.2% |
6th |
|
Road transportation of passengers |
5.6% |
5th |
4.5% |
7th |
|
Other services mainly rendered to enterprises |
2.5% |
12th |
3.4% |
8th |
|
Financial support services, for insurance and complementary pension funding |
3.1% |
9th |
3.4% |
9th |
|
Non-real estate rents and management of non-financial intangible assets |
2.0% |
17th |
2.9% |
10th |
|
Audiovisual services |
3.1% |
8th |
2.8% |
11th |
|
Office and administrative support services |
1.7% |
18th |
2.8% |
12th |
|
Services for buildings and landscape activities |
2.1% |
14th |
2.7% |
13th |
|
Investigation, surveillance, security and cash transportation services |
2.3% |
13th |
2.7% |
14th |
|
Air transportation |
2.8% |
10th |
2.6% |
15th |
|
Purchase, sale and rent of privately-owned property |
1.2% |
23rd |
1.7% |
16th |
|
Sewage, collection, residue treatment and disposal, and material recovery |
1.3% |
20th |
1.7% |
17th |
|
Manpower recruitment, agencying and rental |
2.0% |
15th |
1.6% |
18th |
|
Housing services |
1.6% |
19th |
1.6% |
19th |
|
Mailing and other delivery activities |
2.0% |
16th |
1.6% |
20th |
|
Water transportation |
1.3% |
21st |
1.3% |
22nd |
|
Rail and metro-rail transportation |
1.3% |
22nd |
1.2% |
21st |
|
Edition and edition integrated with printing |
2.7% |
11th |
1.2% |
23rd |
|
Pipeline transportation |
0.7% |
25th |
1.1% |
24th |
|
Continuing education activities |
0.5% |
30th |
1.0% |
25th |
|
Maintenance and repair of motor vehicles |
0.8% |
24th |
0.9% |
26th |
|
Personal services |
0.6% |
28th |
0.8% |
27th |
|
Intermediation in purchase, sale and rent of real estate |
0.7% |
26th |
0.8% |
28th |
|
Cultural, recreation and sport activities |
0.6% |
27th |
0.7% |
29th |
|
Travel agencies, tourism operators and other tourism services |
0.5% |
29th |
0.6% |
30th |
|
Maintenance and repair of computer and communication equipment |
0.5% |
31st |
0.5% |
31st |
|
Support services for agriculture, livestock farming and forestry |
0.4% |
32nd |
0.4% |
32nd |
|
Maintenance and repair of personal and household objects |
0.3% |
33rd |
0.2% |
33rd |
|
News agencies and other information services |
0.1% |
34th |
0.1% |
34th |
|
Source: IBGE, Diretoria de Pesquisas, Coordenação de Serviços e Comércio, Pesquisa Anual de Serviços: 2007/2016 |
||||
Non-real estate rents and management of non-financial intangible assets, and office and administrative support services were those that mostly rose in the ranking of net operating revenue. The first activity rose seven positions, changing from the 17th position in 2007 to the 10th position in 2016, accounting for 2.9% of the services revenue. Office and administrative support services rose six positions, reaching the 12th position in 2016 (2.8%).
On the other hand, the activities that mostly lost positions against 2007 were: edition and edition integrated with printing, and air transportation. Having decreased to the 23rd position, edition and edition integrated with printing lost 12 positions in this period, accounting for 1.2% of the net operating revenue in 2016.
The enterprises of air transportation, on their turn, changed from the 10th position to the 15th position, representing 2.6% of the revenue in the end of the period.
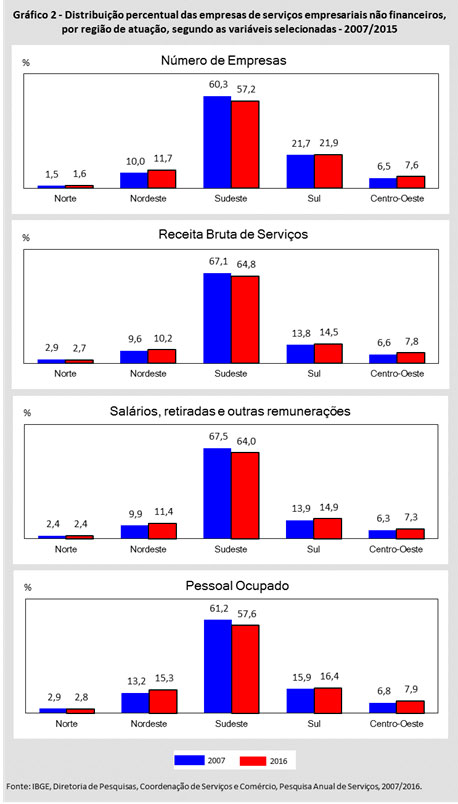
In 2016, Southeast remains leader region of Services sector
The Southeast presented the biggest concentration of enterprises, of gross revenue of service rendering, of wages, withdrawals and other compensation, and of employed persons.
In 2016, 57.2% of the enterprises of the services sector were located in the Southeast, against 57.9% in 2015 and 60.3% in 2007. In the other regions, the figures were 21.9% in the South (same result as in 2015 and against 21.7% in 2007), 11.7% in the Northeast (against 11.2% in 2015 and 10.0% in 2007), 7.6% in the Central-West (against 7.5% in 2015 and 6.5% in 2007) and 1.6% in the North (against 1.5% in 2015 and in 2007).
The Southeast was also the region with the highest concentration of gross revenue, though it lost share as it changed from 67.1% in 2007 to 64.8% in 2016. On its turn, the Central-West was the region that mostly gained share, as it changed from 6.6% in 2007 to 7.8% in 2016.
The South and the Northeast gained 0.7 p.p. and 0.6 p.p. over 2007, respectively. In 2016, 14.5% of the gross revenue of services was concentrated in the South and 10.2%, in the Northeast. Conversely, the North lost share, changing from 2.9% in 2007 to 2.7% in 2016.
Only the Southeast (64.8% in 2016 against 64.3% in 2015) and the Central-West (7.8% in 2016 against 7.8% in 2015) gained share in gross revenue over 2015. The South (14.6% in 2015 against 14.5% in 2016), Northeast (10.5% in 2015 against 10.2% in 2016) and North (2.8% in 2015 against 2.7% in 2016) recorded losses.
The wage bill paid to the persons employed in the services enterprises decreased its concentration in the Southeast, changing from 67.5% in 2007 to 64.0% in 2016. Having a share of 9.9% in the wage bill in 2007, the Northeast was the region that mostly gained share, as it changed to 11.4% in 2016.
The South and Central-West regions increased their share in the period by 1.0 p.p., the former posting 14.9% of the wage bill of services in 2016 and the latter, 7.3%. The North maintained its share of 2.4% in the two periods under analysis.
Compared with 2015, the Central-West, Northeast and South registered gains in the share of wage bill. The South gained two percentage points, accounting for 14.9% of the wage bill in 2016, while the gain was of one percentage point in the Central-West (7.3% in 2016 against 7.2% in 2015) and Northeast (11.4% in 2016 against 11.3% in 2015). The Southeast (64.0% in 2016 against 64.3% in 2015) and North (2.4% in 2016 against 2.5% in 2015) retreated.
The Northeast recorded the biggest increase in the share of persons employed in the services sector, changing from 13.2% in 2007 to 15.3% in 2016. The Central-West and South also gained share in this period. On the other hand, the Southeast lost share, decreasing from 61.2% in 2007 to 57.6% in 2016. The loss of share was less impressive in the North (0.1 p.p.), representing 2.8% of the persons employed in services enterprises in 2016.
In relation to 2015, the Southeast (57.6% in 2016 against 57.5% in 2015), Northeast (15.3% in 2016 against 15.1% in 2015) and Central-West (7.9% in 2016 against 7.8% in 2015) gained share of persons employed. Conversely, the South (16.4% in 2016 against 16.7% in 2015) and North (2.8% in 2016 against 2.9% in 2015) lost share.