2017 Census of Agriculture: preliminary results show drop of 2.0% in number of establishments and rise of 5% in total area


July 26, 2018 10h00 AM | Last Updated: February 19, 2019 01h03 PM
Up to now, the 2017 Census of Agriculture pinpointed 5,072,152 agricultural establishments in Brazil, in a total area of 350,253,329 hectares. That area increased 5% (16.5 million hectares, the equivalent of the area of the state of Acre) over the 2006 Census of Agriculture, despite the reduction of 2% (103,484) in the number of establishments. Nevertheless, the number of establishments increased by 74,864 when the producers without any area were excluded. It should also be highlighted that methodological differences contributed to the drop in the number of producers without any area from 255,019 in 2006 to 76,671 in 2017.
Among the establishments with 1,000 ha and over, both the number (more 3,287) and area (more 16.3 million ha) rose. Its share in the total area changed from 45% in 2006 to 47.5% in 2017. The share in the total area of the establishments between 100 and 1,000 ha fell from 33.8% to 32% (less 814,574 ha), as they decreased by 4,152 units.
Concerning the legal status of the land, the proportion of establishments in their own lands increased from 76.2% to 82%, though their share in the total area reduced from 90.5% to 85.4%. On the other hand, the proportion of establishments in rented lands dropped from 6.5% in 2006 to 6.3% in 2017, though their share in the total area grew from 4.5% to 8.6%.
In 2017, 15,036,978 persons were employed in the agricultural establishments. That represented a drop of 1.5 million persons in 11 years, including producers, their relatives, temporary and permanent workers. The average number of persons employed in the establishments also retreated from 3.2 persons in 2006 to 3 persons in 2017. Conversely, the number of tractors increased 49.7% in that period and reached 1.22 million units. In 2017, about 734 thousand establishments used tractors.
It should also be highlighted that 1,681,001 producers used agrotoxins in 2017, an increase of 20.4% over 2006. The use of irrigation also expanded, by increasing 52% both in the number of establishments (502,425) and in area (6,903,048 hectares). In addition, the access to the Internet in the agricultural establishments rose 1,790.1%, changing from 75 thousand in 2006 to 1,425,323 producers who reported to access it in 2017.
About 15.5% of the producers stated that they had never attended school and 79.1% did not go beyond primary school. On the other hand, the share of women and seniors aged 65 years and over heading establishments expanded, reaching 18.6% and 21.41%, respectively. In 2006, women represented 12.7% of the producers and seniors, 17.52%. For the first time ever, the Census of Agriculture investigated the color or race of the producers: 52% of them were black or brown and 45% were white, a distribution similar to the Brazilian population, according to the 2017 Continuous PNAD.
Among the addresses visited, only 6,582 (or 0.13%) did not respond to the 2017 Census of Agriculture. The results shown in this preliminary release did not include about 3 thousand questionnaires, which were still under validation, and 1,213 establishments of special data collection (large enterprises and producers).
This preliminary release of the 2017 Census of Agriculture brings information on the characteristics of the agricultural producers and establishments; legal status of the land and producers; employed persons; infrastructure of the establishments; and characteristics of the livestock and forestry (silviculture products and inventories, horticulture, floriculture, forestry, permanent and temporary crops), among other subjects. The support material of this release of the 2017 Census of Agriculture is on the right size of this page.
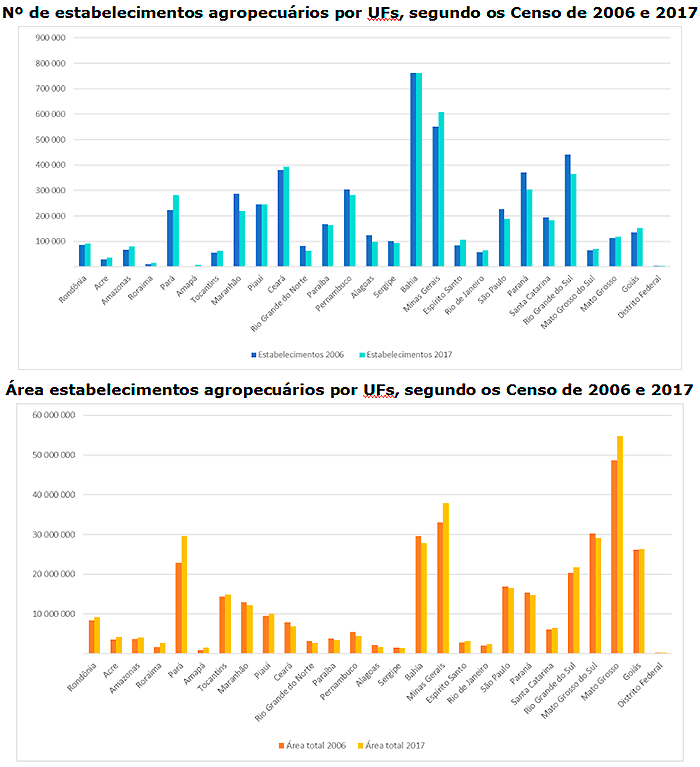
Establishments lose 9.9 million hectares in Northeast
Between 2006 and 2017, the total area occupied by agricultural establishments increased 5.0% – 16,573,292 hectares, the equivalent of the state of Acre, approximately –, despite the reduction of 2% (103,484) in the number of establishments. Excluding the producers without any area (beekeepers, extrativist population and livestock farmers at roadsides), the number of establishments increased by 74,864 in that period. Methodological differences contributed to the drop in the number of producers without any area from 255,019 in 2006 to 76,671 in 2017.
Only the Northeast recorded a drop both in the number (less 131,565) and in the area (less 9,901,808 ha, approximately the state of Pernambuco) of the agricultural establishments. Even with a drop in the number of establishments (less 152,971), the South Region posted an increase in the area (more 1,082,517 ha).
Share of establishments with 1,000 hectares and more increases
Between 2006 and 2017, the share of the establishments equal or greater than 1,000 ha in the total area rose from 45.0% to 47.5%. Having more 3,287 establishments and 16.3 million hectares, the average area of that group expanded from 3,155.7 to 3,272.4 ha.
On the other hand, the establishments between 100 and less than 1,000 ha lost their share in the total area, changing from 33.8% to 32.0%. Those establishments reduced by 4,152 units and 814,574 ha, and the average area varied from 266.0 ha to 266.7 ha.
In the intermediate strata (less than 100 ha), the share remained virtually stable, changing from 21.2% to 20.5%. The number of establishments increased by 74,942 and the average area remained at 15.8 ha.
Proportion of rented land changes from 4.5% to 8.6% of total area
Concerning the legal status of the land between 2006 and 2017, the proportion of establishments that reported to have their own land increased from 76.2% to 82%. Nevertheless, the share of own lands in the area decreased from 90.5% to 85.4%. Conversely, the proportion of rented land reduced from 6.5% in 2006 to 6.3% in 2017, yet the share of such land in the area rose from 4.5% to 8.6%. The establishments in "lent or occupied" land changed from 9.7% to 9.6% and from 2.2% to 2.8% in the area.
Areas of natural forest in agricultural establishments rise 11.4%
In regard to the land use in agricultural establishments between 2006 and 2017, the area used for permanent crops like, for instance, fruits and coffee, reduced by 31.7%. On the other hand, the area destined to temporary crops, like grains and sugarcane, grew 13.2%.
The areas of natural pasture also reduced by 18.7%, while the areas destined to planted pasture increased 9.1%. The Census also shows the increase in the amount of hectares destined to natural forests (11.4%), which are the native forests, and planted forests (79.2%), which are areas destined to silviculture.
Employed personnel falls by 1.5 million in 11 years and number of tractors increases 49.7%
In 2017, 15,036,978 persons were employed in the agricultural establishments on September 30, an average of 3 persons per establishment among producers and their relatives, as well as temporary and permanent workers. Of the total number of persons employed on that date, producers and their relatives represented 73% (10,958,787).
Compared with the 2006 Census of Agriculture, the number of employed persons reduced by 1,530,566, as they were 16,567,544 persons on December 31, 2006. The average number of employed persons per establishment also dropped from 3.2 persons in 2006 to 3 in 2017, as well as the percentage and total number of producers and their relatives, which changed from 77% (12,801,179 persons) in 2006 to 73% (10,958,787) in 2017.
In contrast to the drop in the employed personnel, the number of tractors rose 49.7% (407,916 more units) compared with the 2006 Census of Agriculture, reaching 1,228,634 units on September 30, 2017. The number of establishments that used this type of machinery increased by more than 200 thousand, reaching 733,997 producers in 2017.
Irrigated areas in establishments grow 52%
In 2017, 502,425 agricultural establishments reported to use some method of irrigation, whereas the total irrigated area in Brazil was of 6,903,048 hectares. The number of establishments with irrigation increased 52% and the irrigated area, 52%, in relation to the 2006 Census of Agriculture.
Use of agrotoxins rises 20.4% in 11 years
The 2017 Census of Agriculture investigated whether producers used agrotoxins in the reference period. The data showed that 1,681,001 producers used agrotoxins and that 134,360 producers used them, yet they did not need to apply them in the reference period. That figure represented a growth of 20.4% over 2006, when 1,396,077 producers reported to have used agrotoxins.
Access to Internet grows 1,790.1%
In 2017, 1,425,323 producers reported to access the Internet, being 659 thousand (46.2%) through broadband and 909 thousand (63.77%) through mobile Internet. In 2006, only 75 thousand agricultural establishments accessed the Internet, which represented an increase of 1,790.1% in 2017.
The access to telephones also rose. The existence of telephone devices in the establishments stood out, changing from 1.2 million to 3.1 million properties accessing telephones between 2006 and 2017, an increase of 1.9 million or 158%.
In 2017, 79.1% are educated up to primary school
Of the total number of producers, 15.5% reported that they had never attended school, 29.7% had never surpassed the literacy level and 79.1% had never surpassed primary school. In addition, 1,163,354 producers (23.05%) reported that they neither read nor write. On the other hand, only 0.29% of the producers (14,449) attended master or doctorate, whereas other 5.58% (281,606) attended higher education.
Women and seniors increase share among producers
Between 2006 and 2017, the total number of establishments in which the producer was a woman rose from 12.7% to 18.6% (945,490 persons), while men changed from 87.3% to 81.4% (4,100,900) of the total.
Concerning age, the share of the groups aged less than 25 years (3.30% to 2.03%), from 25 to less than 35 (13.56% to 9.49%) and from 35 to less than 45 (21.93% to 18.29%) reduced, whereas the older groups increased their share: from 45 to less than 55 (23.34% to 24.77%), from 55 to less than 65 (20.35% to 24.01%) and from 65 and over (17.52% to 21.41%).
The result was the same in absolute numbers, as groups up to 45 years dropped and the higher ones rose. The largest contingent concentrated in the group between 45 and 55 years, which added up to 1,221,953 producers, while the biggest growth took place in the class of 55 up to less than 65, which gained 131,005 new members in the 2006-2017 comparison.
Blacks and browns add up to 52% of producers
The color or race of the producers who ran the establishment was investigated for the first time in a Census of Agriculture. On its own, the white population was the largest among the producers (45% or 2,291,153 persons), closely followed by the brown population (44% or 2,242,993). The black population added up to 8% (422,595). The Indians and the yellow population added up to 1% (56,183) and 0.6% (33,463), respectively.
The comparison with the figures of the General Characteristics of Residents and Households module of the Continuous National Household Sample Survey - Continuous PNAD of 2017 pointed out that the percentage of the white population was slightly bigger (45% among producers and 43.6% among the total population) and slightly smaller among the brown population (44% among producers against 46.8% among the total population). The number of blacks was similar, registering 8.6% among the total population against 8% among the producers.
