Unemployment rate is 5.6%; underutilization rate is 13.3% in quarter ending in May


June 26, 2026 09h00 AM | Last Updated: June 29, 2026 10h13 AM
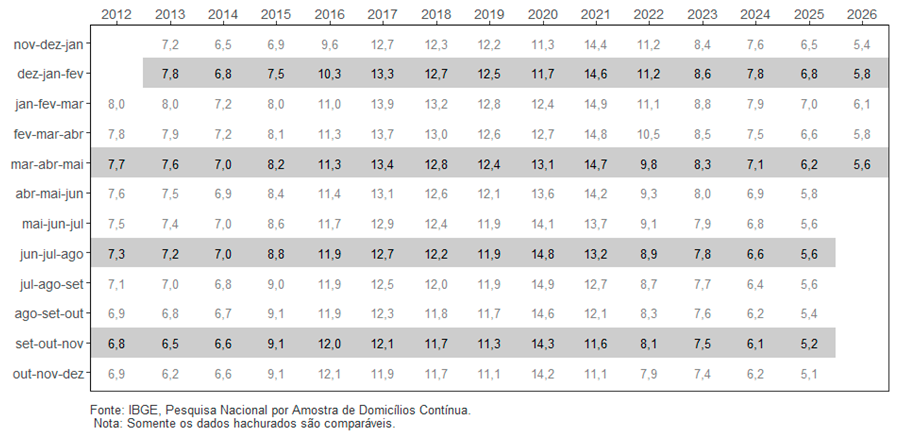
The unemployment rate (5.6%) remained stable in the quarter ending in May 2026 compared to the quarter from December 2025 to February 2026 (5.8%) and fell 0.6 p.p. compared to the moving quarter from March to May 2025 (6.2%).
| Indicator/Period | Mar-Apr-May 2026 | Dec-Jan-Feb 2026 | Mar-Apr-May 2025 |
|---|---|---|---|
| Unemployment rate | 5.6% | 5.8% | 6.2% |
| Underutilization rate | 13.3% | 14.1% | 14.9% |
| Usual real earnings | R$3,726 | R$3,756 | R$3,583 |
| Change of usual real earnings in relation to: | stability | 4.0% | |
The unemployed population (6.1 million) registered stability in comparison with the quarter from December 2025 to February 2026 (6.2 million). Compared to the same quarter of the previous year (6.7 million), it dropped 9.3% (624 thousand people less).
The employed population (102.7 million) registered an increase of 0.5% in the quarter (558 thousand more people) and an increase of 0.8% in the year (840 thousand more). The employment-population ratio (percentage of employed people in the population at working age) was 58.6%, with a change of 0.2 in the quarter (58.4%) and remaining stable in the year (58.6%).
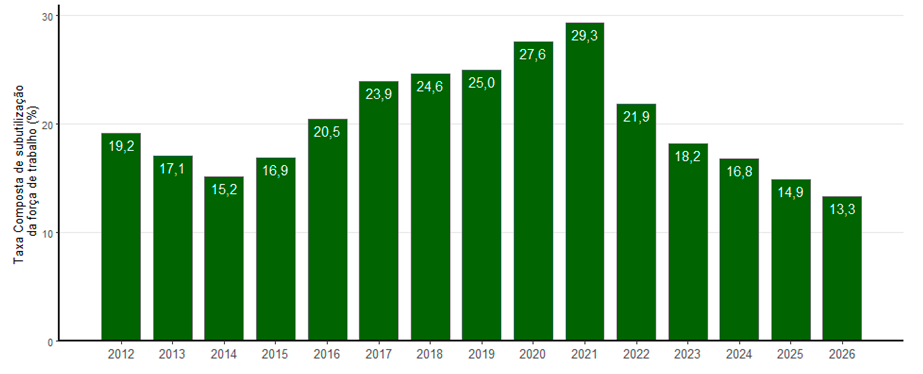
The composite underutilization rate (13.3%) changed -0.8 p.p. compared to the previous quarter (14.1%) and had a drop of 1.6 p.p. in the year (14.9%). The underutilized population (15.1 million) fell 5.7% in the quarter (920 thousand less) and fell 11.3% in the year (1.9 million less underutilized people).
The time-related underemployed population (4.1 million) fell 5.7% in the quarter (251 thousand people less) and fell 10.6% in the year (4.6 million). The population out of the workforce (66.5 million) remained stable in the quarter and grew 1.7% compared to the same quarter of the previous year (1.1 million more people).
The discouraged population (2.4 million) showed a reduction of 10.2% in the quarter (277 thousand people less) and also recorded a 14.6% drop in the year (2.9 million discouraged people). The percentage of discouraged people (2.2%) showed a change of -0.3 p.p. in the quarter (2.4%) and of -0.4 p.p. in the year (2.6%).
The number of persons employed in the private sector with a formal contract (excluding domestic workers) was 39.3 million persons. It remained stable in the quarter and in the year. The number of employees without a formal contract in the private sector (13.4 million) remained stable in the quarter and in the year.
The number of self-employed workers (26.0 million) remained stable in the quarter and in the year. The number of domestic workers (5.4 million) showed stability in the quarter and a reduction of 328 thousand people in the year.
The informality rate was 37.3% of the employed population (or 38.3 million informal workers), compared to 37.5% (or 38.3 million) in the quarter ending in February and 37.8% (or 38.5 million) in the quarter from March to May 2025.
The usual real earnings from all jobs (R$3,726) remained stable in the quarter and grew 4.0% in the year. The usual real wage bill (R$377.7 billion) was stable in the quarter and grew 4.8% (plus R$17.3 billion) in the year.
Unemployment rate - Brazil - 2012/2026
The workforce (employed and unemployed people) reached 108.8 million people in the quarter from March to May 2026, an increase of 381 thousand people (0.4%), when compared to the quarter from December 2025 to February 2026. It remained stable compared to the same quarter of the previous year.
The analysis of employment by activity group of the moving quarter from March to May 2026, in relation to the quarter from December 2025 to February 2026, showed an increase: Transportation, storage and mailing (3.0%, or 177 thousand more people) and Public administration, defense, social security, education, human health and social services (3.1%, or 591 thousand more people). The other groups did not change significantly.
In comparison with the quarter from March to May 2025, an increase was observed in the groups: Agriculture, livestock, forestry, fishing and aquaculture (3.7%, or 277 thousand more people), Transportation, storage and mailing (4.0%, or 236 thousand more people), Public administration, defense, social security, education, human health and social services (3.8%, or 711 thousand more people). The group of domestic services retreated (5.7%, or 329 thousand fewer people).
Composite underutilization rate – Quarters from March to May – Brazil - 2012/2026 (%)
The real average monthly earnings usually received from the main job, according to the activity groups, in the moving quarter from March to May 2026, in relation to the quarter from December 2025 to February 2026, showed that there was no growth in any category. There was a reduction in the group of Public administration, defense, social security, education, human health and social services (1.9%, or less R$97).
The comparison with the quarter from March to May 2025 showed an increase in the categories: Transportation, storage and mailing (5.7%, or more R$191), Public administration, defense, social security, education, human health and social services (3.0%, or more R$147), Other services (12.3%, or more R$341) and Domestic services (3.8%, or more R$ 52). The other groups did not change significantly.
The analysis of the real average monthly income usually received in the main job, according to the employment type of the moving quarter from March to May 2026, in relation to the quarter from December 2025 to February 2026, showed that there was no growth in any category. There was a reduction in the Employee category in the public sector (including statutory servants and the military) (3.1%, or less R$172). The comparison with the quarter from March to May 2025 indicated an increase in the categories: Employee with a formal employment contract (3.0%, or more R$99), Domestic workers (3.8%, or more R$52) and Self-employed workers (4.4%, or more R$130).
Find out more about the Continuous National Household Sample Survey – Monthly Release – Continuous Monthly PNAD
What is the Continuous PNAD?
Time Series
Tables
Publications


