Continuous PNAD: unemployment rate is 5.6% labor underutilization rate is 13.9% in the quarter ended in September


October 31, 2025 09h00 AM | Last Updated: November 03, 2025 05h48 PM
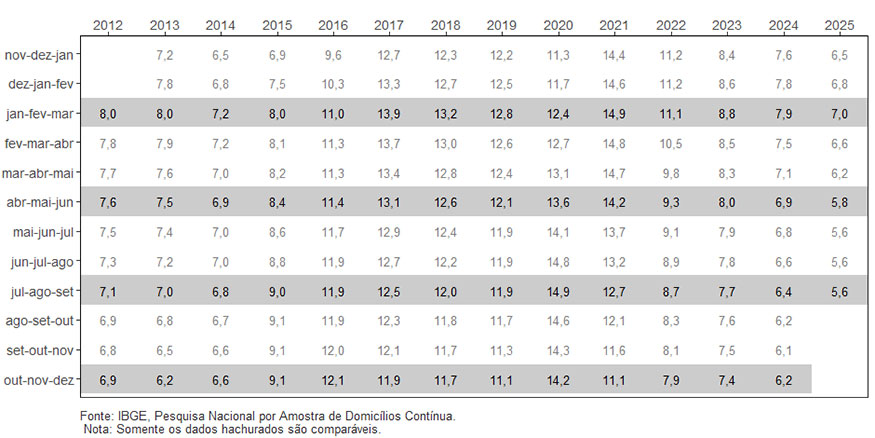
The unemployment rate (5.6%) in the quarter ended in September 2025 equaled the lowest rate in the time series that began in 2012, decreasing in both comparisons: -0.2 percentage points (pp) compared to the previous moving quarter (5.8%) and -0.8 pp compared to the same moving quarter of 2024 (6.4%).
| Indicator/Period | Jul-Aug-Sept 2025 | Apr-May-Jun 2025 | Jul-Aug-Sept 2024 |
|---|---|---|---|
| Unemployment Rate | 5.6% | 5.8% | 6.4% |
| Labor Underutilization Rate | 13.9% | 14.4% | 15.7% |
| Usual Real Earnings | R$ 3,507 | R$ 3,497 | R$ 3,373 |
| Change of usual real earnings in relation to: | Stable (0.3%) | 4.0% | |
The unemployed population (6.0 million) was the smallest contingent in the time series, decreasing by 3.3% (or 209,000 less persons) in the quarter and falling by 11.8% (809,000 less persons) year-on-year. The employed population (102.4 million) remained stable in the quarter and grew by 1.4% (1.4 million more persons) year-on-year.
The employment-to-population ratio (percentage of employed persons in the working-age population) was 58.7%, showing no significant change compared to the previous quarter (58.8%) and increasing by 0.3 percentage points (58.4%) year-on-year.
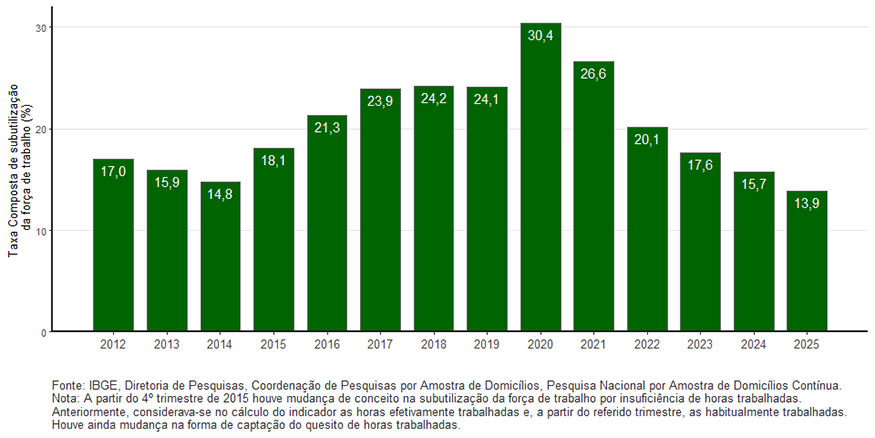
The composite labor underutilization rate (13.9%) was again the lowest in the series, decreasing in both comparisons: -0.5 percentage points compared to the previous quarter (14.4%) and -1.8 percentage points compared to the same quarter of 2024 (15.7%). The underutilized population (15.8 million) reached its lowest level since the quarter ending in December 2014, decreasing in both comparisons: -4.0% (664,000 less persons) in the quarter and -11.4% (2.0 million less persons) year-on-year.
The population in time-related underemployment (4.5 million) remained stable in the quarter and decreased by 9.9% (497,000 fewer people) year-on-year. The population outside the labor force (65.9 million) increased in both comparisons: 0.6% (423,000 more persons) in the quarter and 1.2% (750,000 more persons) year-on-year.
The discouraged population (2.6 million) was the lowest since the quarter ending in December 2015, remaining stable in the quarter and decreasing by 14.1% (434,000 less persons) year-on-year. The percentage of discouraged workers (2.4%) remained stable in the quarter and decreased by 0.4 percentage points year-on-year.
The number of employed persons in the private sector (52.7 million) was a record high for the series, but without significant changes in the quarter or the year.
The number of employed persons with formal contracts in the private sector (excluding domestic workers) reached a new record high for the series (39.2 million), remaining stable in the quarter and increasing by 2.7% (an additional 1.0 million workers) year-on-year. The number of employed persons without formal contracts in the private sector (13.5 million) remained stable in the quarter and decreased by 4.0% (569,000 less persons) year-on-year. The number of employed persons in the public sector (12.8 million) remained stable in the quarter and increased by 2.4% (an additional 299,000 people) year-on-year.
The number of self-employed workers (25.9 million) remained stable in the quarter and increased by 4.1% (an additional 1 million) over the year.
The informality rate was 37.8% of the employed population (or 38.7 million informal workers), repeating the 37.8% (or 38.7 million) of the previous quarter and below the 38.8% (or 39.2 million) of the quarter ended in September 2024.
The usual real earnings from all jobs (R$ 3,507) was a record high, remaining statistically stable in the quarter and growing by 4.0% year-on-year.
The usual real wage bill (R$ 354.6 billion) was again a record high, remaining stable in the quarter and showing an increase of 5.5% (an additional R$ 18.5 billion) over the year.
Unemployment Rate - Brazil - 2012/2025
The workforce (employed and unemployed persons) in the July-September 2025 quarter was estimated at 108.5 million people, showing stability compared to the previous quarter and a 0.5% increase (an additional 566,000 people) year-on-year.
Analysis of employment by activity groups compared to the previous moving quarter showed an increase in employed persons in two groups: Agriculture, livestock, forestry, fishing and aquaculture (3.4%, or an additional 260,000 workers) and Construction (3.4%, or an additional 249,000 workers). There was a reduction in two groups: Trade, repair of motor vehicles and motorcycles (1.4%, or 274,000 less persons) and Domestic services (2.9%, or 165,000 less persons), with stability in the others.
Compared to the July-September 2024 quarter, there was an increase in two groups: Transportation, storage and mailing (6.7%, or an additional 371,000 workers) and Public administration, defense, social security, education, human health and social services (3.9%, or an additional 724,000 workers). There was a reduction in the Domestic services group (5.1%, or 301,000 less persons). The other groups did not show significant change.
Composite labor underutilization rate – Quarter from July to September – Brazil – 2012 to 2025 (%)
The average real monthly earnings by activity group, compared to the previous moving quarter, showed an increase in one category: Lodging and food (5.5%, or an increase of R$ 122). The other groups did not show significant change.
Compared to the July-September 2024 quarter, there was an increase in five categories: Agriculture, livestock, forestry, fishing and aquaculture (6.5%, or an increase of R$ 134), Construction (5.5%, or an increase of R$ 145), Information, Communication and Financial, Real Estate, Professional and Administrative Activities (3.9%, or an increase of R$ 184), Public administration, defense, social security, education, human health and social services (4.3%, or an increase of R$ 199) and Domestic services (6.2%, or an increase of R$ 79). The other groups did not show significant change.


