Continuous PNAD: annual average unemployment rates are the lowest in time series in 14 Federation Units


February 14, 2025 09h00 AM | Last Updated: February 17, 2025 04h43 PM
The unemployment rate (6.2%) did not register any significant change against the previous quarter (6.4%) and dropped 1.2 p.p. The Brazilian unemployment rate was 6.2% in the fourth quarter of 2024, not significantly changing in relation to the previous quarter (6.4%) and retreating 1.2 p.p. over the same moving quarter in 2023 (7.4%). The annual average rate fell from 7.8% in 2023 to 6.6% in 2024, the lowest annual average in the time series, started in 2012. The highest average unemployment rates in 2024 were in Bahia, Pernambuco (both with 10.8%), Federal District (9.6%) and Rio de Janeiro (9.3). The lowest average annual unemployment rates were in Mato Grosso (2.6%), Santa Catarina (2.9%) and Rondônia (3.3%).
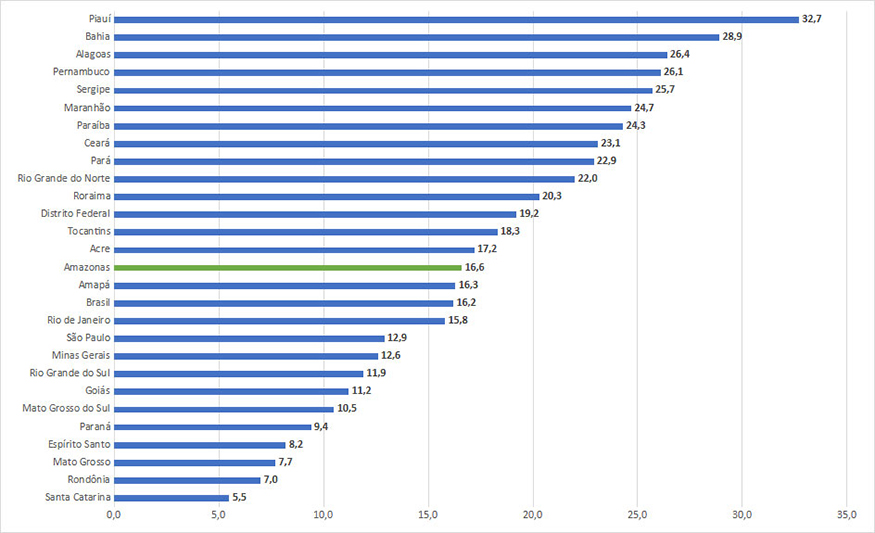
The average annual underutilization rate for Brazil was 16.2%. Piauí (32.7%) registered the highest rate, followed by Bahia (28.9%) and Alagoas (26.4%), whereas the lowest annual rates were in Santa Catarina (5.5%), Rondônia (7.0%) and Mato Grosso (7.7%).
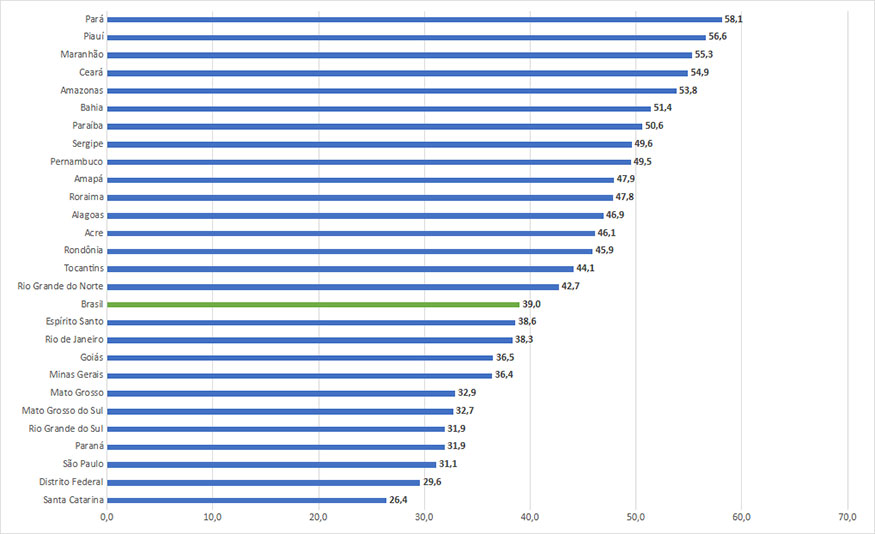
The average annual informality rate for Brazil was 39.0% of the employed population.
The highest annual averages were in Pará (58.1%), Piauí, (56.6%) and Maranhão (55.3%) and the lowest ones, in Santa Catarina (26.4%), Federal District (29.6%) and São Paulo (31.1%).
The annual average of the usual real earnings from all jobs hit R$3,225.
The highest averages were in Federal District (R$5,043), São Paulo (R$3,907) and
Paraná (R$3,758). The lowest averages were in Maranhão (R$2,049),
Ceará (R$2,071) and Bahia (R$2,165).
| 2012 | 2013 | 2014 | 2015 | 2016 | 2017 | 2018 | 2019 | 2020 | 2021 | 2022 | 2023 | 2024 | |
|---|---|---|---|---|---|---|---|---|---|---|---|---|---|
| Brazil | 7.4 | 7.3 | 7.0 | 8.9 | 11.7 | 12.6 | 12.2 | 11.8 | 13.8 | 14.0 | 9.6 | 7.8 | 6.6 |
| Rondônia | 5.7 | 5.2 | 3.9 | 5.7 | 8.2 | 7.6 | 9.4 | 8.1 | 10.0 | 9.4 | 4.2 | 3.2 | 3.3 |
| Acre | 9.1 | 8.5 | 8.2 | 8.9 | 10.5 | 14.2 | 13.4 | 14.7 | 15.7 | 16.2 | 12.4 | 7.5 | 6.4 |
| Amazonas | 9.7 | 9.9 | 8.7 | 9.5 | 14.0 | 14.5 | 13.9 | 14.1 | 14.8 | 15.4 | 13.1 | 9.9 | 8.4 |
| Roraima | 8.0 | 7.8 | 7.5 | 8.9 | 8.7 | 10.5 | 13.0 | 14.9 | 16.6 | 13.8 | 4.9 | 6.6 | 7.5 |
| Pará | 7.4 | 7.1 | 7.8 | 9.4 | 11.4 | 11.4 | 11.6 | 10.6 | 10.5 | 13.0 | 9.7 | 7.7 | 7.2 |
| Amapá | 13.3 | 12.5 | 12.6 | 10.9 | 16.0 | 17.4 | 20.7 | 16.3 | 16.8 | 14.4 | 13.7 | 11.3 | 8.3 |
| Tocantins | 7.9 | 7.1 | 6.6 | 9.8 | 12.2 | 10.9 | 10.9 | 12.0 | 11.2 | 14.2 | 7.6 | 5.8 | 5.5 |
| Maranhão | 7.9 | 8.1 | 7.6 | 8.8 | 11.9 | 13.5 | 14.6 | 14.1 | 15.5 | 17.5 | 11.4 | 7.9 | 7.1 |
| Piauí | 6.0 | 7.4 | 6.0 | 8.2 | 9.9 | 12.2 | 12.8 | 12.2 | 14.6 | 13.0 | 10.0 | 9.8 | 7.2 |
| Ceará | 7.8 | 7.7 | 7.1 | 8.8 | 11.9 | 12.4 | 11.6 | 11.1 | 13.3 | 14.0 | 9.4 | 8.5 | 7.0 |
| Rio Grande do Norte | 10.8 | 10.8 | 11.2 | 11.6 | 13.5 | 14.6 | 12.9 | 13.1 | 16.3 | 15.6 | 11.9 | 10.7 | 8.5 |
| Paraíba | 9.6 | 9.2 | 8.1 | 9.6 | 11.1 | 10.2 | 10.5 | 12.6 | 17.8 | 16.1 | 12.4 | 9.6 | 8.3 |
| Pernambuco | 9.3 | 8.8 | 8.2 | 10.3 | 15.1 | 17.0 | 16.2 | 15.2 | 17.1 | 20.2 | 15.9 | 13.4 | 10.8 |
| Alagoas | 11.4 | 10.3 | 9.8 | 11.5 | 14.5 | 17.4 | 16.6 | 14.5 | 19.4 | 18.7 | 12.0 | 9.2 | 7.6 |
| Sergipe | 10.3 | 10.2 | 8.9 | 9.2 | 12.1 | 14.4 | 16.5 | 15.5 | 19.6 | 20.6 | 13.1 | 11.4 | 9.0 |
| Bahia | 11.4 | 11.5 | 9.8 | 11.3 | 16.2 | 16.6 | 16.6 | 16.3 | 20.3 | 21.3 | 15.1 | 13.2 | 10.8 |
| Minas Gerais | 6.7 | 7.0 | 6.7 | 8.8 | 11.3 | 12.1 | 10.8 | 10.3 | 12.7 | 12.1 | 7.7 | 5.8 | 5.0 |
| Espírito Santo | 7.4 | 6.8 | 7.1 | 9.0 | 12.4 | 13.0 | 11.0 | 10.3 | 12.9 | 12.7 | 8.5 | 5.7 | 3.9 |
| Rio de Janeiro | 7.6 | 6.9 | 6.9 | 8.7 | 12.3 | 14.9 | 14.8 | 14.7 | 17.7 | 18.1 | 13.3 | 10.1 | 9.3 |
| São Paulo | 7.2 | 7.5 | 7.4 | 10.1 | 12.4 | 13.5 | 13.2 | 12.4 | 14.0 | 14.4 | 9.1 | 7.5 | 6.2 |
| Paraná | 5.0 | 4.3 | 4.0 | 6.0 | 8.2 | 8.9 | 8.3 | 8.3 | 9.7 | 8.9 | 6.0 | 4.8 | 4.1 |
| Santa Catarina | 3.4 | 3.4 | 3.0 | 4.4 | 6.5 | 7.4 | 6.3 | 6.3 | 6.4 | 5.1 | 3.8 | 3.4 | 2.9 |
| Rio Grande do Sul | 5.4 | 5.0 | 5.5 | 6.3 | 8.1 | 8.5 | 8.3 | 7.8 | 9.4 | 8.8 | 6.4 | 5.4 | 5.2 |
| Mato Grosso do Sul | 6.1 | 4.6 | 4.1 | 6.6 | 7.1 | 9.6 | 8.0 | 7.9 | 9.5 | 9.5 | 4.9 | 4.7 | 3.9 |
| Mato Grosso | 5.1 | 4.4 | 4.2 | 6.2 | 9.6 | 8.8 | 7.8 | 8.2 | 9.5 | 9.4 | 4.0 | 3.3 | 2.6 |
| Goiás | 5.0 | 5.6 | 6.1 | 7.5 | 10.7 | 11.0 | 9.2 | 10.7 | 13.1 | 11.8 | 7.7 | 5.8 | 5.4 |
| Federal District | 8.9 | 9.0 | 9.7 | 10.4 | 12.0 | 12.5 | 12.3 | 13.4 | 14.1 | 14.6 | 11.3 | 10.1 | 9.6 |
| Source: IBGE - Continuous PNAD | |||||||||||||
The highest average unemployment rates in 2024 were in Bahia, Pernambuco (both with 10.8%), Federal District (9.6%) and Rio de Janeiro (9.3%). The lowest average annual unemployment rates were in Mato Grosso (2.6%), Santa Catarina (2.9%) and Rondônia (3.3%).
The annual average unemployment rate was the lowest one in the time series in 14 Federation Units: Acre (6.4%), Amazonas (8.4%), Amapá (8.3%), Tocantins (5.5%), Maranhão (7.1%), Ceará (7.0%), Rio Grande do Norte (8.5%), Alagoas (7.6%), Minas Gerais (5.0%), Espírito Santo (3.9%), São Paulo (6.2%), Santa Catarina (2.9%), Mato Grosso do Sul (3.9%) and Mato Grosso (2.6%).
The annual average employment- population ratio hit 58.6% in 2024. The highest percentages for that indicator were reported in Mato Grosso (68.4%), Santa Catarina (67.0%) and Goiás (65.3%) and the lowest ones, in Maranhão (47.3%), Acre and Ceará (both with 48.7%) and Alagoas (48.8%). the employment- population ratio is the proportion of employed persons in the population aged 14 years and over.
Employment- population ratio by Federation Unit - annual averages in 2024

The highest annual average unemployment rates in 2024 were in Bahia, Pernambuco (both with 10.8%), Federal District (9.6%) and Rio de Janeiro (9.3%). The lowest average annual unemployment rates were in Mato Grosso (2.6%), Santa Catarina (2.9%) and Rondônia (3.3%).
Unemployment rate by Federation Unit - annual averages in 2024

The average annual underutilization rate for Brazil was 16.2%. Piauí (32.7%) registered the highest rate, followed by Bahia (28.9%) and Alagoas (26.4%), whereas the lowest annual rates were in Santa Catarina (5.5%), Rondônia (7.0%) and Mato Grosso (7.7%).
Underutilization rate by Federation Unit – annual averages in 2024
The average annual informality rate for Brazil was 39.0% of the employed population. The highest annual averages were in Pará (58.1%), Piauí, (56.6%) and Maranhão (55.3%) and the lowest ones, in Santa Catarina (26.4%), Federal District (29.6%) and São Paulo (31.1%).
Informality rate by Federation Unit – annual averages in 2024
The annual average of the
The highest averages were in Federal District (R$5,043), São Paulo (R$3,907) and
Paraná (R$3,758). The lowest averages were in Maranhão (R$2,049), Ceará (R$2,071) and Bahia (R$2,165).
Usual real earnings from all jobs by Federation Unit - annual averages in 2024


