Continuous PNAD: unemployment rate is 6.6% and underutilization rate is 16.0% in the quarter ended in August


September 27, 2024 09h00 AM | Last Updated: October 01, 2024 04h33 PM
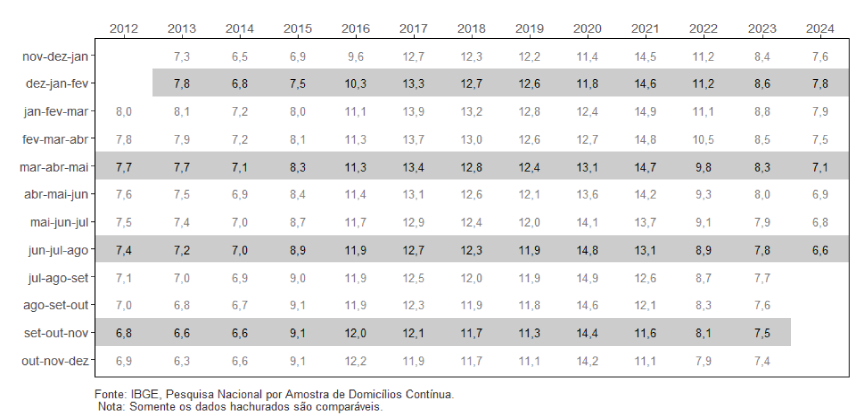
The unemployment rate (6.6%) in the quarter ended in August 2024 fell by 0.5 percentage points (pp) compared to the quarter from March to May 2024 (7.1%) and fell by 1.2 pp compared to the same moving quarter in 2023 (7.8%). This was the lowest unemployment rate for a quarter ended in August in the Continuous PNAD Contínua time series, which began in 2012.
| Indicator/Period | Jun-Jul-Aug 2024 | Mar-Apr-May 2024 | Jun-Jul-Aug 2023 |
|---|---|---|---|
| Unemployment rate | 6.6% | 7.1% | 7.8% |
| Underutilization rate | 16.0% | 16.8% | 17.6% |
| Usual real earnings | R$ 3,228 | R$ 3,209 | R$ 3,073 |
| Change of real earnigs in relation to: | stable (0.6%) | 5.1% | |
The unemployed population (7.3 million) fell in both comparisons: -6.5% (502 thousand fewer persons) in the quarter and -13.4% (1.1 million fewer persons) in the year. This was the lowest number of unemployed persons since the quarter ending in January 2015.
The employed population (102.5 million) was a new record in the time series that began in 2012, growing in both comparisons: 1.2% (1.2 million more persons) in the quarter and 2.9% (2.9 million more persons) in the year. The employment-to-population ratio (percentage of employed persons in the working-age population) was 58.1%, growing in both comparisons: 0.6 percentage points compared to the previous moving quarter (57.6%) and 1.2 percentage points in the year (57.0%). This was the highest employment-to-population ratio for a quarter ending in August since 2013.
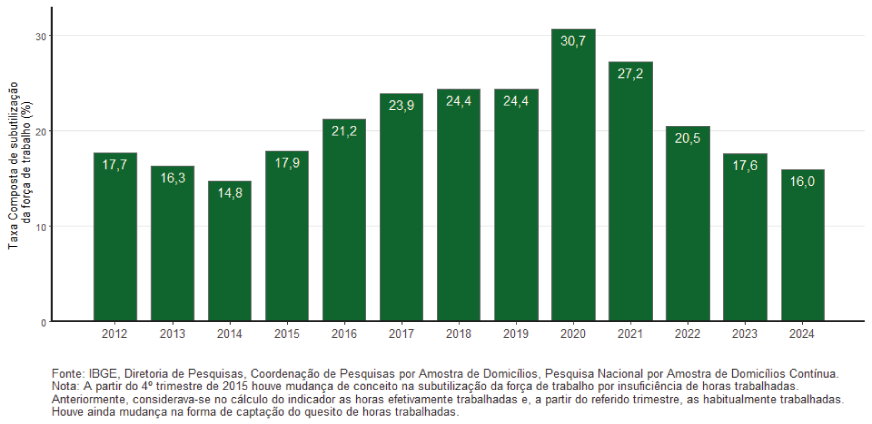
The composite underutilization rate (16.0%) fell in both comparisons: -0.9 pp in the quarter and -1.7 pp in the year. It was the lowest rate for a quarter ending in August since 2014. The underutilized population (18.5 million persons) was the lowest since the rolling quarter ending in June 2015 (18.2 million), falling in both comparisons: -4.7% (919 thousand less) in the quarter and -8.5% (1.7 million less) in the year.
Time-related underemployment (5.1 million) did not have a significant change in the quarter and fell 4.1% (-219 thousand) in the year. The population outside the workforce (66.5 million) fell by 0.5% (-321 thousand) in the quarter and did not change significantly in the year.
The discouraged population (3.1 million) reached its lowest number since the quarter ended in May 2016 (3.0 million), falling by 5.9% (195 thousand less persons) in the quarter and 12.4% (442 thousand less persons) in the year. The percentage of discouraged workers in the workforce or the discouraged (2.8%) fell by 0.2 percentage points in the month and 0.4 percentage points in the year.
The number of workers in the private sector reached 52.9 million, a new record in the series that began in 2012, with increases of 1.7% (882 thousand more persons) in the quarter and 4.9% (2.5 million more persons) in the year. The number of workers with formal employment contracts in the private sector (excluding domestic workers) reached 38.6 million, another record. There was an increase of 0.8% (317 thousand more persons) in the quarter and 3.8% (1.4 million more persons) in the year. The number of workers without formal employment contracts in the private sector (14.2 million) was also a record, with increases of 4.1% (565 thousand more persons) in the quarter and 7.9% (1.0 million more persons) in the year.
The number of self-employed workers (25.4 million) remained stable in both comparisons, as did the number of domestic workers (5.8 million) and employers (4.3 million). The number of workers in the public sector (12.7 million) was a record, increasing 1.8% (221 thousand persons) in the quarter and 4.3% (523 thousand persons) in the year.
The informality rate was 38.8% of the employed population (or 39.8 million informal workers) compared to 38.6% in the quarter ending in May and 39.1% in the same quarter of 2023.
The usual real earnings from all jobs (R$3,228) remained stable in the quarter and grew 5.1% in the year. The usual real wage bill (R$326.2 billion) grew 1.7% (more R$5.5 billion) in the quarter and 8.3% (more R$24.9 billion) in the year.
Unemployment rate - Brazil - 2012/2024
The workforce (employed and unemployed persons) in the quarter from June to August 2024 was estimated at 109.8 million persons, a new record in the time series that began in 2012. This population grew in both comparisons: 0.6% (683 thousand more persons) compared to the quarter ending in May 2024 and 1.6% (1.7 million more persons) in the year.
The analysis of employment by activity groups compared to the quarter from March to May 2024 showed an increase only in the group of Trade, repair of motor vehicles and motorcycles (1.9%, or 368 thousand more persons). The other groups did not show significant change.
Compared to the quarter from June to August 2023, there was an increase in the following groups: General Industry (4.2%, or 526 thousand more persons), Construction (5.2%, or 370 thousand more persons), Trade, repair of motor vehicles and motorcycles (2.6%, or 486 thousand more persons), Transportation, storage and mail (6.0%, or 325 thousand more persons), Information, Communication and Financial, Real Estate, Professional and Administrative Activities (5.7%, or 699 thousand more persons), Public administration, defense, social security, education, human health and social services (3.4%, or 614 thousand more persons) and Other services (5.6%, or 293 thousand more persons). There was a reduction in the Agriculture, livestock, forestry, fishing and aquaculture group (4.2%, or 354 thousand fewer persons).
Composite underutilization rate – Quarters from June to August – Brazil – 2012 to 2024 (%)
The analysis of the usual average real monthly earnings from the main job, according to the activity groups, for the three-month period from June to August 2024, compared to the three-month period from March to May 2024, showed an increase in the Construction category (4.6%, or more than R$110). The other groups did not show significant change.
Compared to the same quarter of 2023, there was an increase in the following categories: Industry (7.3%, or R$215 more) Construction (6.3%, or R$148 more), Trade, repair of motor vehicles and motorcycles (4.0%, or R$103 more), Transportation, storage and mailing (4.8%, or R$138 more), Public administration, defense, social security, education, human health and social services (4.6%, or R$196 more) and Other services (6.7%, or R$156 more). The other groups did not show significant change.
All employment types showed stability in real average monthly earnings compared to the quarter from March to May 2024.
Compared to the quarter from June to August 2023, there was an increase in the following categories: Workers with a formal employment contract (3.4%, or R$99 more), Workers without a formal employment contract (8.4%, or R$173 more), Workers in the public sector (including statutory and military workers) (3.4%, or R$159 more) and Self-employed (7.0%, or R$171 more).


