Continuous PNAD 2020: decrease in employment leads to increased participation of income transfers in household income


November 19, 2021 10h00 AM | Last Updated: December 01, 2021 02h31 AM
From 2019 to 2020, the proportion of households with persons that receive money from other social programs went from 0.7% to 23.7%, with increases in all the Major Regions, mainly in the North (from 0.5% to 32.2%) and Northeast (0.8% to 34.0%).That was due to the Emergency Aid, created by the federal government because of the coronavirus pandemic and paid to informal workers, individual microentrepreneurs (MEI, in Portuguese), self-employed workers and unemployed persons. In the 2020 edition of Continuous PNAD, this benefit was classifed as “other income”, which encompasses income from social programs, financial applications, employment insurance, unemployment benefit for artisanal fishermen, etc.
The proportion of families benefited by the Bolsa Familia Program fell from 14.3% to 7.2%, since part of the beneficiaries started being paid the Emergency Aid. The proportion of housing units receiving BPC-LOAS went from 3.5% to 3.1% in the period.
The number of persons with other income jumped from 16.4 million in 2019 to 30.2 million (from 7.8% to 14.3% of the population) in 2020, whereas that of persons with income from work fell by 92.8 million to 84.7 million (from 44.3% to 40.1% of the population). This decrease is related to the decline in the employed population in 2020. In addition to that, for the first time since 2012, the group of other income has surpassed that of persons who receive retirement pensions (26.2 million or 12.4%).
From 2019 to 2020, other income increased its participation in the composition of household income per capita in Brazil, with a change from 3.4% to 7.2%. The share of income from work fell from 74.4% to 72.8%. Decreases were also recorded by income from retirement pensions or other pensions (from 18.7% to 17.6%), rental and leasing (from 2.4% to 1.5%) and alimony, donations or allowances (from 1.2% to 0.8%).
The real average income from all sources fell by 3.4%, having changed from R$2,292 in 2019 to R$2,213 in 2020. The Southeast accounted for the highest figure (R$2,575) and the Northeast, for the lowest (R$1,554), being the only Major Region that recorded no decrease.
Income from other sources fell by 15.4%, and reached the lowest figure (R$1,295) since 2012. Among the categories that compose income from otehr sources, the item retirement pension or other pensions, despite its record decrease of 5.1%, accounted for the highest average in 2020 (R$1,919). Other income (R$678) grew by 12.3% against 2019, biggest annual increase; however, against 2012, that estimate was practically leved off.
On the other hand, average real monthy earnings from all the activities increased by 3.4% from 2019 to 2020, and hit R$2,447. The exit of 8.1 million persons from the employed population led to the rise of that average in the period.
In turn, real average monthly household income per capita fell by 4.3% in 2020, and reached R$1,349. Income per capita in households benefited by other social programs increased by 12.2% between 2019 and 2020, with a change from R$688 to R$772.
In 2020, persons in the group of 1% with the highest earnings (average monthly household per capita of R$15,816) earned 34.9 times the amount of those 50% with the lowest earnings (average earnings of R$453). In 2019, that ratio reached 40, highest value in the series.
The Gini Index of the average household income per capita changed from 0.544 in 2019 to 0.524 in 2020. The Northeast had the highest Gini index in 2020 (0.526) and the Southeast, the lowest (0.457). Between 2019 and 2020, the Gini index fell in all the Major Regions, mainly in the North and Northeast, where the Emergency Aid reached the biggest proportion of housing units.
These data are from Continuos Pnad 2020: Income from all sourcrs, which already includes the reweighting of the survey’s time series (technical note 3/2021).
Share of earnings in total income records decrease
Among the 211.1 million residents in the country in 2020, 61.5% (128.7 million) had some kind of earnings. The biggest proportion was in the South Region (65.4%), whereas the North and Northeast had the smallest percentages (54.6% and 57.3%, respectively). Against 2019, the Northeast was the only Major Region to record a positive chaange, with a change from 53.4% to 54.6% in the period.
In 2020, 40.1% of the resident population (84.7 million) had earnings and 28.3% (59.7 million) received income from other sources. Against 2019, there was a decrease of the corresponding share of earnings, which was 44.3% (92.8 million) in the previous year, and an increase in the contribution of income from other sources, which corresponded to 23.6% (49.5 million). This trend was observed in all the Major Regions.
The South kept the biggest percentage of persons having earnings (46.%). The Northeast recorded, for the first time, a percentage of persons with earnings (32.3%) below that of persons who received it from other sources (32.8%).
Number of persons with other income increases from 16.4 to 30.2 million, in one year
The number of persons with other income (employment insurance/unemployment benefit for artisanal fishermen, governmental social programs – including the Emergency Aid –, income from savings, etc.) almost doubled from 2019 to 2020, having changed from 16.4 million (7.8% of the population) to 30.2 million (14.3%). For the first time in the series, this group surpassed that of persons who received retirement pensions and other pensions (26.2 million or 12.4%), having become the main one in the category of income from other sources. Then came rental and leasing (1.3%) and alimony, donation or allowance from a non-resident (1.7%).
In the North (17.5%), Northeast (19.7%) and Central West (12.1%), the percentage of persons who had other income exceeded that of persons who had income from other sources rather than work.
Income from all sources fell by 3.4% but Northeast Region records decrease
Between 2019 and 2020, the average real monthly income from all sources (including work and other sources) fell by 3.4%, with a change from R$2,292 to R$2,213. The top figure was that of the Southeast Region (R$2,575), followed by the Central West (R$2,466) and South (R$2,441), whereas the lowest one was that of the Northeast (R$1,554) From 2019 to 2020, the decrease of income was mainly observed in the Southeast (4.7%), South (4.3%) and Central West (3.3%). The Northeast Region was the was the only one not to record decrease, with a change from R$1,538 (2019) to R$1,554 (2020).
Income from other sources falls to its lowest figure since 2012
In 2020, income from other sources fell by 15.4%, and reached the lowest figure (R$1,295) since 2012. Decrease was observed in all the Major Regions, mainly in the Southeast, South and Central West, where losses reached 19.6%, 13.2% and 21.0%, respectively.
Among the categories that compose income from otehr sources, the item retirement pension or other pensions, despite its record decrease of 5.1%, accounted for the highest average in 2020 (R$1,919). In all the Major Regions, retirement or retirement pensions was the category with the highest figure, with a change from R$1,540 in the North to R$2,268 in the Central West. By Major region, the loss in value was widespread, and reached 10.7% in the North and 8.8% in the Central West.
Other income (R$678) increased 12.3% against 2019. The North and Northeast recorded significant increases, from 47.% and 55.0%, respectively. In the North, the average figure went from R$435 in 2019 to R$643 in 2020; in the Northeast; it went from R$400 to R$620. On the other hand, in the Southeast and South, this type of income fell 16.5% and 5.0%, respectively.
Income coming from rental and lease posted an average value of R$1,622 and dropped against 2019 (5.1%) and 2012 (9.7%). Alimony, donation or allowance from a non-resident amounted, on the average, R$646, the same as in 2019 and 5.2% above the result of 2012.
Value of earnings increases by 3.4%
The average real monthly income from all the activities (calculated for persons aged 14 and over, employed in the week of reference) was of R$2,447 in 2020, 3.4% more than in 2019 (R$2,366). This increase was due to the exit of 8.1 million persons from the employed population in the period, indicating that those who remained employed had lower earnings.
Against 2012, when the estimate was of R$2,269, increase reached 7.8%. The Northeast Region (R$1,751) and North (R$1,814) recorded the smallest increases, and Southeast (R$2,793), Central West (R$2,651) and South (R$2,611), the biggest.
After reduction of the employed population, wage bill decreases by 5.6%
In 2020, the average usual real monthly earnings from all jobs added up to a monthly wage bill 5.6% lowerthan than estimated for 2019, standing at nearly R$207.4 billion. Against 2012, wage bill increased by 5.5%.
Among the factors that account for this decrease is the significant decrease of the employed population (by 8.7%), which reached the lowest figure in the series (84.7 million). Against 2012, when the employed population was 86.7 million, the decrease hite 2.2%.
The Southeast kept the highest wage bill in 2020 (R$10.7.6 billion) in 2020, followed by the South Region (R$36.2 billion). The lowest wage bill was recorded in the North Region (12.1 billion). In all the Major Regions, there was a decrease of wage bill between 2019 and 2020, with a decrease of the employed population, mainly in the Northeast (11.8%) and Southeast (8.8%).
Distribution of earnings is more uneven in the Northeast
The Gini index of the average monthly usual real earnings from all jobs was 0.500 in 2020, below that of 2019 (0.506). Once more, the decrease in the number of employed persons, mainly of self-employed workers, domestic workers and workers without a private contract, may have made the distribution of earnings a little less uneven. /p>
The South (0.436) and Central-West (0.476) Regions recorded the lowest indexes and the Northeast, the highest (0.532). The Northeast Region was the only one to record a positive change.
Emergency aid causes share of other income in household income to increase
In 2020, earnings from all jobs comprised 72.8% of the average real monthly household earnings per capita, slightly below 2019 (74.4%). The 27.2% coming from other sources were mostly split into retirement pensions and pensions (17.6%), rental and leasing (1.5%), alimony, donation or allowance from non-resident (0.8%) and other earnings (7.2%).
Participation in household income per capita, by type of income - Brazil (%)
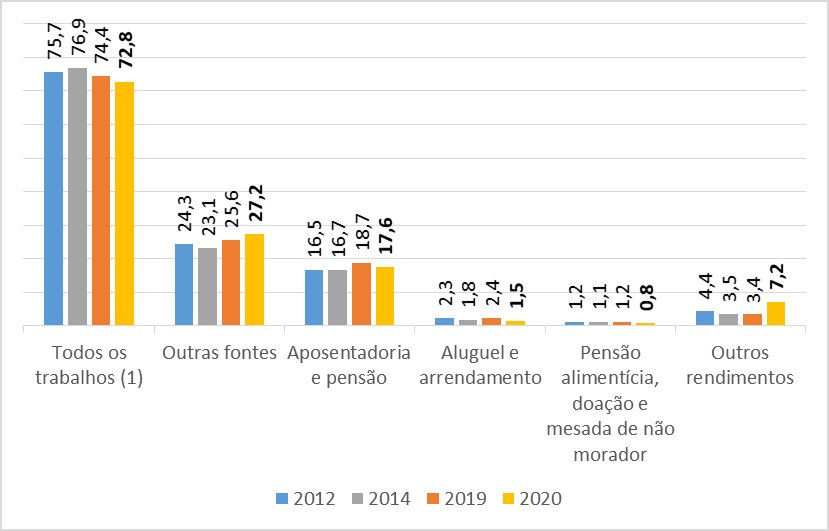
The increase in the participation of other income stands out, eith a change from 3.4% in 2019 to 7.2% of the household income per capita in 2020. This category encompasses, besides income from financial applications, employment insurance,unemployment benefit for artisanal fishermen, etc., social progrms such as Bolsa Familia, Continuous Cash Benefit (BPC-LOAS) and Emerency Aid, created to be an aid during the Covid-19 pandemic.
Among the Major Regions, income from all the activities changed from 63.4%, in the Northeast Region, to 77.7%, in the Central West Region. Other income reached 4.4% in the South and 13.7% in the Northeast. With the start of the Emergency Aid, the share of this category went from 5.1% to 12.5% in the North, and from 5.5% to 13.7% in the Northeast.
Proportion of housing units that have receive money from other social programs increased from 0.7% to 23.7%
As the Emergency Aid was created, the percentage of housing units changed from 0.7% in 2019 to 23.7% in 2020. That increase was observed in all the Major Regions.
The proportion of families benefited by the Bolsa Familia Program fell from 14.3% to 7.2%, since part of the beneficiaries started being paid the Emergency Aid. The proportion of housing units receiving BPC-LOAS went from 3.5% to 3.1% in the period.
The North and Northeast Regions had the biggest proportions of housing units as beneficiaries of social programs: 12.9% and 14.2%, respectively, had income from Bolsa Família; 5.0% and 4.5% received income from BPC-LOAS; and 32.2% and 34.0% had income from other social programs, mainly the Emergency Aid.
..
| Brazil and Major Regions | Income from governmental social programs | |||||||||||
|---|---|---|---|---|---|---|---|---|---|---|---|---|
| Bolsa Família | BPC-LOAS | Other social programs | ||||||||||
| 2012 | 2014 | 2019 | 2020 | 2012 | 2014 | 2019 | 2020 | 2012 | 2014 | 2019 | 2020 | |
| Brazil | 16.6 | 15.7 | 14.3 | 7.2 | 2.5 | 2.7 | 3.5 | 3.1 | 1.4 | 1,7 | 0.7 | 23.7 |
| North | 28.4 | 28.2 | 26.3 | 12.9 | 3.8 | 3.7 | 5.7 | 5.0 | 2.7 | 2.7 | 0.5 | 32.2 |
| Northeast | 34.8 | 33.6 | 29.0 | 14.2 | 4.4 | 4.4 | 5.4 | 4.5 | 1.7 | 3.4 | 0.8 | 34.0 |
| Southeast | 8.0 | 7.3 | 7.5 | 4.0 | 1.5 | 1.8 | 2.5 | 2.4 | 1.2 | 0.9 | 0.6 | 19.7 |
| South | 7.2 | 5.8 | 5.1 | 2,.9 | 1.6 | 1.7 | 2.1 | 1.7 | 0.8 | 0.7 | 0.5 | 14.4 |
| Central West | 11.3 | 10.7 | 9.1 | 5.0 | 2.7 | 2.9 | 3.9 | 3.8 | 2.1 | 1.9 | 1.0 | 20.6 |
| Source: IBGE, Pesquisa Nacional por Amostra de Domicílios Contínua 2012/2020. | ||||||||||||
Average real monthly household income per capita fell by 4.3%
The average real monthly household income per capita was of R$1,349 in 2020, 4.3% below the figure estimated in 2019 (R$1,410). The North and Northeast had the lowest figures (R$896 and R$891), despite the increase of 2.3% and 0.9% in the period. The Southeast Region still has the highest average household income per capita (R$1,623), followed by the South Region (R$1,597). Between 2019 and 2020, there was a decrease of averga yield in the Southeast Region (6.0%), South (6.3%) and Central West (5.2%).
Income per capita in housing units that received from other programs increased by 12.2%
The average real monthly household income per capita in households that received Bolsa Família reached R$379 in 2020, and, in the ones that did not, R$1,453. For the households that received BPC LOAS, the per capita household average income was R$792 and for those that did not receive it, R$1,368. In housing units that received other social programs, average income reached R$772, against R$1,565 in those that did not. Between 2019 and 2020, the number of housing units that received money from other social programs fell by 12.2%.
Income of the poorest 50% increases by 3.9% from 2019
In the stratification of ranges of percentages of persons in increasing orded of household income per capita in 2020, half of the population with the lowest income made, on the average, R$453. If compared to 2019, income was 3.9% higher (R$436).
The South Region (R$661) had the highest average of monthly household income per capita for the 50% of the population with the lowest income in 2020, and the North (R$325) and Northeast (R$301), the lowest. However, between 2019 and 2020, only the North and Northeast had an increase in this indicator (17.8% and 16.2%, respectively), which can be related to the Emergency Aid.
| Brazil and Major Regions | Average real monthly income per capita of the 50% of the population with the lowest income (R$) | |||
|---|---|---|---|---|
| 2012 | 2014 | 2019 | 2020 | |
| Brazil | 415 | 462 | 436 | 453 |
| North | 280 | 310 | 276 | 325 |
| Northeast | 253 | 292 | 259 | 301 |
| Southeast | 556 | 604 | 585 | 570 |
| South | 622 | 688 | 687 | 661 |
| Central West | 520 | 573 | 566 | 556 |
| Notes: 1. Income at average prices of 2020. 2. In the composition of household income per capita, earnings is obtained only for persons aged 14 and over. 3. Ranges of percentage of persons were calculated based on the respective percentiles. This way, P50 represents approximately 50% of the population with the lowest income. |
||||
| Source: IBGE, Pesquisa Nacional por Amostra de Domicílios Contínua 2012/2020. | ||||
In the comparison between 2019 and 2020, there was an increase in the average household income per capita in the ranges of income of the first half of the distribution, mainly in the ranges of more than 5% up to 10% (17.6%) and of more than 10% to 20% (9.8%). Considering the range of more than 40% up to 50%, the average monthly household per capita starts to reduce in the period, mainly in the last percentile (decrease of 9.4%).
Earnings of the 1% best paid represent 34.9 times the earnings of the 50% that are paid less
Persons in the last percentile of income, thta is, that comprising 1% of the Brazilian population with the highest earnings – average real monthly earnings of R$15,816 – received, on average, 34.9 times the earnings of half of the population with the lowest earnings – real monthly average earnings of R$453). In 2019, that ratio reached 40, highest value in the series.
Decrease of the Gini index reflects the Emergency Aid, mainly in the North and Northeast
The Gini Index of the average household income per capita changed from 0.544 in 2019 to 0.524 in 2020.
The Northeast had the highest Gini index in 2020 (0.526) and the Southeast, the lowest (0.457). Between 2019 and 2020, the Gini index fell in all the Major Regions, mainly in the North and Northeast, where the Emergency Aid reached the biggest proportion of housing units.
Household wage bill per capita increases in the North and Northeast only
The real monthly household income per capita of R$284.6 billion in 2020, bekow the figure in 2019 (R$295.2 billion). The Southeast concentrated 50.7% of this wage bill (R$144.4 billion). Between 2019 and 2020, only the North and Northeast recorded an increase in household wage bill per capita (3.6% and 1.4%). The biggest decreases were in the South (-5.7%) and Southeast (-5.2%).
The 10% with the lowest earnings in the population had a share of 0.9% of the wage bill, whereas the 10% with the highest earnings held 41.6% of the total. The latter had a share of wage bill almost equivalent to the 80% of the population with the lowest income (43.0%). However, between 2019 and 2020, the group with the 10% highest income reduced its participation (-1.2 p.p.), whereas the deciles with the lowest income recorded a positive change.


