Life expectancy was 76.6 years in 2019


November 26, 2020 10h00 AM | Last Updated: December 04, 2020 11h25 AM
A person born in Brazil in 2019 was expected to live, on average, up to 76.6 years. It represented an increase of three months in relation to 2018 (76.3 years). Life expectancy of men changed from 72.8 to 73.1 years and, of women, from 79.9 to 80.1 years.
The probability of a newly-born not completing the first year of life was 11.9 per thousand births, standing below the 2018 rate (12.4). It dropped 91.9% since 1940, when it reached 146.6 deaths per thousand births.
The mortality in the childhood – children below five years of age – also declined, from 14.4 per thousand in 2018 to 14.0 per thousand in 2019. Of the children who died before completing 5 years of age, 85.6% had the chance to die in the first year of life and 14.4%, between 1 and 4 years of age.
Among the Federation Units, the highest life expectancy was found in Santa Catarina (79.9 years), 3.3 years above the national average, and the lowest one, in Maranhão (71.4 years). On the other hand, the lowest infant mortality was in Espírito Santo (7.8 per thousand) and the highest one, in Amapá (22.6 per thousand).
This information is available in the Complete Life Tables for Brazil - 2019, which includes life expectancies of exact ages up to 80 years. This information is used as one of the parameters to calculate the social security factor for retirement pensions under the General Social Security System.
Mortality rate before one year of life is 11.9 deaths per thousand births
Between 1940 and 2019, infant mortality declined nearly 91.9% and the mortality rate between 1 and 4 years of age decreased 97.3%. In this period, nearly 135 lives of children under 1 year per each thousand live births were saved, and 198 lives of children under 5 years. In 1940, the mortality rate in the childhood (children up to 5 years) was nearly 212.1 deaths per each thousand live births. In 2019, the rate was 14.0 per thousand.
| Infant mortality rate (per thousand), mortality rate in the group between 1 and 4 years of age (per thousand) and mortality rate in childhood (per thousand) - Brazil - 1940/2019 | |||||
|---|---|---|---|---|---|
| Year | Infant mortality rate (per thousand) |
Mortality rate in the group between 1 and 4 years of age (per thousand) |
Mortality rate in the childhood (per thousand) | Of the children who died before 5 years of age, the chance to die (%) | |
| Before 1 year of age | Between 1 and 4 years of age | ||||
| 1940 | 146.6 | 76.7 | 212.1 | 69.1 | 30.9 |
| 1950 | 136.2 | 65.4 | 192.7 | 70.7 | 29.3 |
| 1960 | 117.7 | 47.6 | 159.6 | 73.7 | 26.3 |
| 1970 | 97.6 | 31.7 | 126.2 | 77.3 | 22.7 |
| 1980 | 69.1 | 16.0 | 84.0 | 82.3 | 17.7 |
| 1991 | 45.1 | 13.1 | 57.6 | 78.3 | 21.7 |
| 2000 | 29.0 | 6.7 | 35.5 | 81.7 | 18.3 |
| 2010 | 17.2 | 2.64 | 19.8 | 86.9 | 13.1 |
| 2019 | 11.9 | 2.04 | 14.0 | 85.6 | 14.4 |
| D% (1940/2019) | -91.9 | -97.3 | -93.4 | ||
| D (1940/2019) | -134.7 | -74.6 | -198.1 | ||
Of the children who died before completing 5 years of age, 85.6% died in the first year of life and 14.4%, between 1 and 4 years of age. The probability of a male newly-born not completing the first year of life was 12.9 per thousand, whereas the rate was 11.0 per thousand for a female newly-born. For both sexes, the mortality rate before the first year of life was 11.9 per thousand.
At 50, life expectancy is 11.8 years higher than in 1940
For 2019, life expectancy at birth was 76.6 years, meaning an increase of 31.1 years for both sexes over the indicators reported in 1940. For men, that increase was of 30.2 years and, for women, of 31.8 years.
In 1940, an individual had a life expectancy of 19.1 years when completing 50 years, living, on average, 69.1 years. In 2019, a 50-year old person would have a life expectancy of 30.8 years, expecting to live, on average, up to 80.8 years (11.8 years more).
| Life expectancies in exact ages, variation in year of the period and average time of life - Brazil - 1940/2019 |
||||||||||||
|---|---|---|---|---|---|---|---|---|---|---|---|---|
| Age | Life Expectancies | Variation (in years) 1940/2019 | Average Time of Life - Both Sexes | |||||||||
| 1940 | 2019 | |||||||||||
| Total | Man | Woman | Total | Man | Woman | Total | Man | Woman | 1940 | 2019 | ||
| 0 | 45.5 | 42.9 | 48.3 | 76.6 | 73.1 | 80.1 | 31.1 | 30.2 | 31.8 | 45.5 | 76.6 | |
| 1 | 52.2 | 49.7 | 54.9 | 76.5 | 73.0 | 80.0 | 24.2 | 23.3 | 25.1 | 53.2 | 77.5 | |
| 5 | 52.5 | 49.7 | 55.3 | 72.6 | 69.2 | 76.1 | 20.2 | 19.5 | 20.8 | 57.5 | 77.6 | |
| 10 | 48.3 | 45.5 | 51.1 | 67.7 | 64.3 | 71.2 | 19.5 | 18.7 | 20.1 | 58.3 | 77.7 | |
| 15 | 43.8 | 41.1 | 46.6 | 62.8 | 59.4 | 66.3 | 19.0 | 18.3 | 19.7 | 58.8 | 77.8 | |
| 20 | 39.6 | 36.9 | 42.5 | 58.1 | 54.8 | 61.4 | 18.5 | 17.9 | 18.9 | 59.6 | 78.1 | |
| 25 | 36.0 | 33.3 | 38.8 | 53.5 | 50.4 | 56.5 | 17.5 | 17.1 | 17.8 | 61.0 | 78.5 | |
| 30 | 32.4 | 29.7 | 35.2 | 48.9 | 46.0 | 51.7 | 16.4 | 16.2 | 16.5 | 62.4 | 78.9 | |
| 35 | 29.0 | 26.3 | 31.6 | 44.3 | 41.5 | 46.9 | 15.3 | 15.2 | 15.3 | 64.0 | 79.3 | |
| 40 | 25.5 | 23.0 | 28.0 | 39.7 | 37.1 | 42.2 | 14.1 | 14.0 | 14.2 | 65.5 | 79.7 | |
| 45 | 22.3 | 19.9 | 24.5 | 35.2 | 32.7 | 37.5 | 12.9 | 12.8 | 13.0 | 67.3 | 80.2 | |
| 50 | 19.1 | 16.9 | 21.0 | 30.8 | 28.5 | 33.0 | 11.8 | 11.6 | 12.0 | 69.1 | 80.8 | |
| 55 | 16.0 | 14.1 | 17.7 | 26.7 | 24.5 | 28.6 | 10.6 | 10.4 | 11.0 | 71.0 | 81.7 | |
| 60 | 13.2 | 11.6 | 14.5 | 22.7 | 20.7 | 24.4 | 9.5 | 9.1 | 10.0 | 73.2 | 82.7 | |
| 65 | 10.6 | 9.3 | 11.5 | 18.9 | 17.2 | 20.4 | 8.4 | 7.8 | 8.9 | 75.6 | 83.9 | |
| 70 | 8.1 | 7.2 | 8.7 | 15.5 | 13.9 | 16.7 | 7.3 | 6.7 | 8.0 | 78.1 | 85.5 | |
| 75 | 6.0 | 5.4 | 6.3 | 12.4 | 11.1 | 13.4 | 6.4 | 5.6 | 7.0 | 81.0 | 87.4 | |
| 80 anos ou + | 4.3 | 4.0 | 4.5 | 9.7 | 8.7 | 10.5 | 5.5 | 4.6 | 6.0 | |||
| Sources: 1940 - Tables built under the Management of Studies and Analyses of the Demographic Dynamics. 2019 - IBGE/Diretoria de Pesquisas. Coordenação de População e Indicadores Sociais. Gerência de Estudos e Análises da Dinâmica Demográfica. Projeção da população do Brasil por sexo e idade para o período 2010-2060. |
||||||||||||
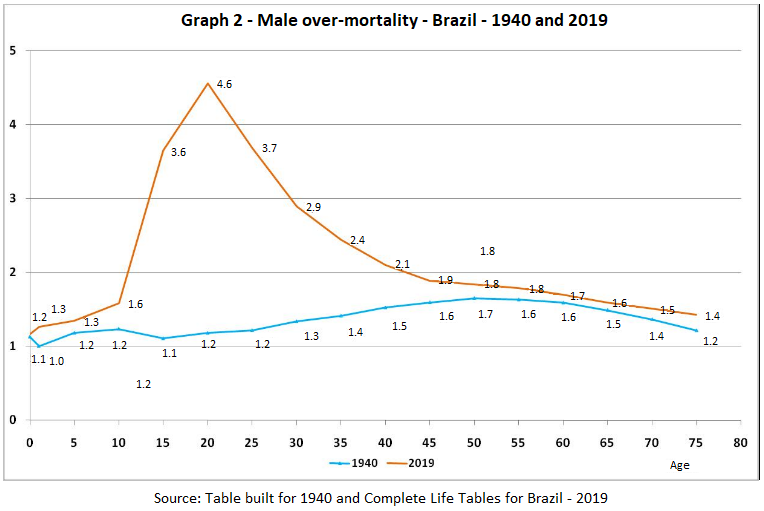
Between 20 and 24 years, men have 4.6 more chances of dying than women
In 2019, a 20-year old man had 4.6 times more chance of not completing 25 years than a woman in the same age group. The range between 15 and 34 years of age showed the highest gap between the mortality rate of the male population in relation to the female one. This phenomenon could be explained by the higher incidence of deaths due to external or non-natural causes, which mostly hits the male population.
Male over-mortality stayed below 2.0 from 45 years onwards. In 1940, the difference did not surpass that level in any age range.
The current scenario reflects the processes of urbanization and metropolization. In 1940, 68.8% of the population lived in rural areas, where the sanitary conditions were poorer and mortality was high in the group of young adults for both sexes, indistinctly.
From the mid-1980s onwards, the deaths associated with external or non-natural causes, which include homicides, suicides, accidents and drownings, happened to perform a prominent role, though negative, on the structure by age of the mortality rates, particularly those of male young adults.
Between 1940 and 2019, the female mortality also decreased within the fertile period, between 15 and 49 years of age. In 1940, from each thousand live births, 777.8 began the reproductive period and, among them, 573.4 completed it. In 2019, from each thousand live births, 985.2 reached 15 years of age and, among them, 946.1 completed it. In other words, the probability of a female newly-born completing the fertile period in 1940, which was 57.3%, changed to 94.6% in 2019.
Life expectancy of elderly persons increases by 8.3 years between 1940 and 2019
In the adult phase (between 15 and 60 years of age), in general, the mortality levels declined. In 1940, from each thousand persons who reached 15 years of age, nearly 535 of them completed 60 years of age. In 2019, of those same thousand persons, 868 completed 60 years of age.
And life expectancy of elderly persons increased 8.3 years in that period. In 1940, when an individual reached 65 years, he/she expected to live, on average, more 10.6 years, 9.3 years in the case of men and 11.5 years, in the case of women. In 2019, these values changed to 18.9 years for both sexes, 17.2 years for men (7.9 years more) and 20.4 years for women (8.9 years more).
The longevity of Brazilians has been increasing over time. In 2019, life expectancy figures at the age of 80 were 10.5 for women and 8.7 years for men; in 1940 these figures were 4.5 for women and 4.0 for men.
In 1940, the population aged 65 years and over represented 2.4% of the total. In 2019, the percentage changed to 9.5%, an increase of nearly 7.1 percentage points.
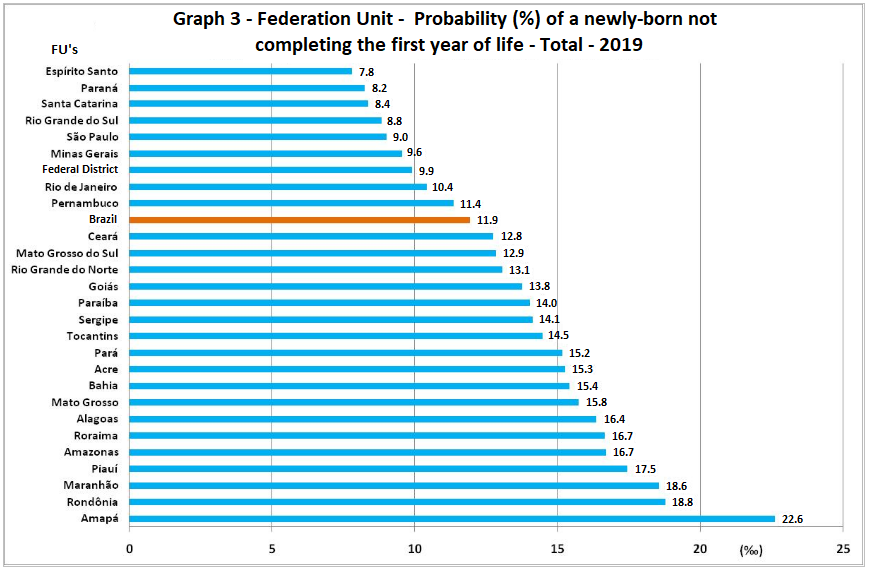
Espírito Santo has the lowest infant mortality rate and Amapá, the highest one
Concerning the Federation Units, the lowest infant mortality rate in 2019, as well as in 2018, was registered in Espírito Santo: 7.8 deaths of 1-year old children per each thousand live births. In contrast, the highest one was, once again, in Amapá: 22.6 per thousand.
Even states like Espírito Santo, Paraná, Santa Catarina, Rio Grande do Sul, São Paulo and Minas Gerais, besides the Federal District, with rates below 10 per thousand, are far from those found in the most developed countries. For example, Japan and Finland had rates below 2 per thousand for the 2015-2020 period. However, they were quite below the countries of Western and Central Africa, whose infant mortality rates were around 90 per thousand. Our rates were closer to China (9.9 per thousand).
In Rondônia, less than half of the persons who complete 60 years reach 80.
Concerning life expectancy at birth, Santa Catarina was the state with the best rate (79.9 years), standing 3.3 years above the national average (76.6 years). It was followed by Espírito Santo, São Paulo, the Federal District, Rio Grande do Sul and Minas Gerais, with figures equal to or above 78.0 years. On the other side, the lowest life expectancy rates were reported in Maranhão (71.4 years) and Piauí (71.6 years).
In nine states, life expectancy at birth of women surpassed 80 years, most of them in the South and Southeast regions, except for Rio Grande do Norte and the Federal District. The biggest differences between life expectancies of men and women were reported in Alagoas (9.5 years), Bahia (9.2 years), Piauí (8.6 years) and Sergipe (8.5 years). Considering the extreme figures of life expectancies between men and women, a newly-born in Santa Catarina expected to live, on average, 15.9 years more than a newly-born in Piauí.
Male mortality surpassed that of women. Nevertheless, life expectancy of men in Santa Catarina (76.7 years) was higher than that of women in the states of Roraima (75.1 years), Maranhão (75.3 years), Rondônia (75.5 years), Piauí (76.0 years) and Amazonas (76.3 years). The biggest probabilities of survival between 60 and 80 years of age were reported in Espírito Santo: 581 per thousand for men and 723 per thousand for women. And the smallest ones, in the states of Piauí for men (427 per thousand) and Rondônia (557 per thousand) for women. For both sexes, the lowest rate was reported in Rondônia, where less than half of the individuals who reached 60 years completed 80 years of age.
| Federation Units - Probability of and 60-year old individual reach 80 years (20p60), by sex and differential between women and men - 2019 |
||||||||
|---|---|---|---|---|---|---|---|---|
| Federation Units | Probability of a 60-year old individual reach 80 years (20 p 60) (per thousand) | 20 pW 60 - 20 pM 60 (per thousand) | ||||||
| 1980 | 2019 | |||||||
| Total | Men | Women | Total | Men | Women | 1980 | 2019 | |
| Brazil | 344 | 291 | 398 | 604 | 532 | 668 | 107 | 136 |
| Rondônia | 160 | 144 | 182 | 496 | 442 | 557 | 38 | 115 |
| Acre | 308 | 301 | 314 | 581 | 505 | 654 | 13 | 149 |
| Amazonas | 310 | 281 | 342 | 530 | 464 | 597 | 61 | 133 |
| Roraima | 219 | 242 | 191 | 527 | 498 | 558 | -51 | 60 |
| Pará | 375 | 320 | 431 | 531 | 462 | 602 | 112 | 141 |
| Amapá | 345 | 323 | 367 | 570 | 520 | 621 | 44 | 100 |
| Tocantins | - | - | - | 576 | 524 | 632 | - | 108 |
| Maranhão | 223 | 168 | 294 | 515 | 440 | 586 | 126 | 146 |
| Piauí | 231 | 191 | 276 | 514 | 427 | 591 | 85 | 165 |
| Ceará | 394 | 346 | 445 | 584 | 516 | 642 | 99 | 126 |
| Rio Grande do Norte | 363 | 324 | 407 | 619 | 535 | 691 | 83 | 155 |
| Paraíba | 351 | 319 | 384 | 578 | 510 | 634 | 66 | 124 |
| Pernambuco | 300 | 264 | 336 | 572 | 495 | 633 | 72 | 138 |
| Alagoas | 318 | 282 | 356 | 544 | 458 | 619 | 74 | 161 |
| Sergipe | 351 | 334 | 367 | 548 | 464 | 622 | 33 | 158 |
| Bahia | 304 | 267 | 342 | 580 | 491 | 660 | 75 | 168 |
| Minas Gerais | 357 | 308 | 407 | 627 | 571 | 678 | 99 | 107 |
| Espírito Santo | 338 | 292 | 390 | 655 | 581 | 723 | 97 | 143 |
| Rio de Janeiro | 353 | 277 | 422 | 598 | 521 | 660 | 145 | 140 |
| São Paulo | 375 | 310 | 439 | 632 | 562 | 692 | 129 | 129 |
| Paraná | 339 | 301 | 386 | 619 | 548 | 685 | 85 | 136 |
| Santa Catarina | 354 | 305 | 407 | 651 | 574 | 723 | 103 | 149 |
| Rio Grande do Sul | 381 | 306 | 453 | 625 | 546 | 695 | 147 | 149 |
| Mato Grosso do Sul | 362 | 349 | 379 | 599 | 519 | 674 | 30 | 155 |
| Mato Grosso | 268 | 247 | 297 | 566 | 510 | 628 | 50 | 118 |
| Goiás | 310 | 286 | 338 | 563 | 506 | 618 | 51 | 113 |
| Federal District | 402 | 323 | 472 | 651 | 568 | 716 | 148 | 147 |
| Source: IBGE, Projeção da população do Brasil e Unidades da Federação por sexo e idade para o período 2010-2060. Revision 2019. 1980 e 1991 - ALBUQUERQUE, Fernando Roberto P. de C. and SENNA, Janaína R. Xavier “Tábuas de Mortalidade por Sexo e Grupos de Idade - Grandes e Unidades da Federação – 1980, 1991 e 2000. Textos para discussão, Diretoria de Pesquisas, IBGE, Rio de Janeiro, 2005.161p. ISSN 1518-675X ; no. 20 | ||||||||

