Demography of Enterprises: in 2018, survival rate of enterprises was 84.1%


October 22, 2020 10h00 AM | Last Updated: October 26, 2020 05h15 PM
The survival rate (84.1%) represented 3.7 million enterprises remaining active in Brazil (out of a total of 4.4 million), standing slightly below that of 2017 (84.8%). On the other hand, the entry rate of new enterprises was 15.9% in 2018, whereas the exit rate stayed at 17.4%. As a result, the balance of enterprises was negative (-65.9 thousand) and represented a sharper loss than that of 2017 (-22.9 thousand enterprises).
Between 2008 and 2018, the entry rate retreated from 21.8% to 15.9% (-5.9 percentage points), hitting its peak of 22.2% in 2009. In contrast, the exit rate was at a similar level as that of 2008 (17.7%), having hit its peak in 2014 (20.7%) and, since then, it has been above the entry rate.
Between 2013 and 2018, Brazil registered a reduction of 382.2 thousand enterprises and of 2.8 million salaried employed persons. In addition, the balance of enterprises has been negative since 2014.
Trade and repair of motor vehicles and motorcycles was the activity that mostly stood out in 2018, contributing to the highest negative balance of enterprises (-88.7 thousand). On the other hand, the sector of Human health and social services gave the biggest positive contribution to the balance of enterprises (23.7 thousand).
The highest entry rates were recorded in Amazonas (22.1%), Maranhão (20.5%) and Amapá (20.4%). Conversely, Rio Grande do Sul (13.3%), Santa Catarina (14.1%) and Minas Gerais (14.9%) posted the lowest rates.
The highest exit rates were registered in Amazonas (21.6%), Pará (20.8%) and the Federal District (20.7%). In contrast, the lowest rates were recorded in the three states of the South Region: Santa Catarina (13.4%), Rio Grande do Sul (15.5%) and Paraná (15.9%), as well as in Piauí (15.9%).
In 2018, the number of high-growth enterprises increased 11.9%, interrupting five consecutive years of drops. These 22,732 high-growth enterprises represented 1.0% of the active enterprises with salaried personnel and 5.0% of the enterprises with 10 or more employed persons. They accounted for 11.2% of the salaried persons and for the payment of 9.1% of the salaries and other compensation of the enterprises with 10 or more salaried persons. The number of high-growth enterprises in 2018 (22,732) was the third lowest in the time series. The highest value in the time series was achieved in 2012 (35,206) and the lowest one, in 2017 (20,306).
Only 5.6% of the enterprises with high-growth between 2008 and 2013 maintained this pace after 5 years.
These are some of the highlights of the Demography of Enterprises and Entrepreneurship Statistics 2018 study, which assesses the corporate dynamics through indicators of entry, exit, re-entry and survival of the enterprises, as well as high-growth enterprises and gazelles, among others.
In 2018, the Central Register of Enterprises - CEMPRE added up to 4.4 million active enterprises, which employed 38.7 million persons, being 32.3 million (83.5%) as salaried persons and 6.4 million (16.5%) as partners or owners. The average age of these companies was 11.6 years.
Salaries and other compensation added up to R$1,1 trillion, with an average monthly salary of 2.7 minimum wages, the equivalent to R$2,559.66, a growth of 0.2% in real terms. The average salary of the enterprises born in 2018 (R$1,668.76) was not only lower than that of the total active enterprises, but also dropped 3.8% in relation to those born in the previous year, a real loss of R%65.53 per month per employee.
Of the total active enterprises, 84.1% (3.7 million) were surviving enterprises and 15.9% were new entrants (697.1 thousand), corresponding to 12.2% of births (536.0 thousand) and 3.7% were re-entrants (161.1 thousand). Nearly 17.4% of the active enterprises (or 762.9 thousand) left the market.
The balance of enterprises, registered by the difference between entries and exits, was negative (-65.9 thousand), as in the last 4 years. The exits were not only higher in absolute terms (762.9 thousand against 697.1 thousand entrants), but they also grew in relative terms (9.1% against the increase of only 3.1% in the number of entrants), resulting in the reduction of 1.5% in the total number of active enterprises (less 65.8 thousand enterprises). Nevertheless, the balance was positive (1.3%) concerning salaried personnel (351.1 thousand persons) and also concerning total employed personnel (0.9%) and wage bill in real terms (0.7%).
New enterprises have lower percentage of persons with higher education
In the active enterprises in 2018, men accounted for most of the employed and salaried population (60.7%) against 39.3% of women. The female participation was similar in the surviving companies (39.2%), as well as in those that entered (40.4%) and left (41.2%) the market.
The analysis of the schooling level of the employees unveiled lower participation of employees with higher education in the event of entry and exit of companies in the market. While the participation of employees with higher education was 8.8% and 7.8% in the dynamics of entry and exit of companies, respectively, such participation was 15.2% in the surviving enterprises, a difference of up to 7.4 percentage points.
Trade was the sector that mostly contributed to reduce the number of enterprises
Only Trade; repair of motor vehicles and motorcycles contributed with a negative balance of 88.7 thousand companies, followed by Manufacturing industries, with less 17,379 enterprises.
Two activities stood out as a positive contribution. Although it did not record a significant participation in entries and exits of companies (only 6.4% and 2.8%, respectively), Human health and social services was the sector that mostly positively contributed to the balance of the number of these entities (23,745 enterprises).
Professional, scientific and technical activities posted the second highest balance (18,409 enterprises).
Exit rate is higher than entry rate since 2014
The Brazilian corporate dynamics changed between 2008 and 2018: the entry rate, which was higher than the exit rate until 2013, became inferior. The entry rate retreated from 21.8% to 15.9% (-5.9 percentage points) in this 10-year period, having hit its peak in 2009 (22.2%). On the other hand, the exit rate (17.4%) was at a similar level as that in 2008 (17.7%) and its highest value occurred in 2014 (20.7%).
Still in the 2008-2018 period, the survival rate increased from 78.2% to 84.1%, being the highest index registered in 2016 (85.5%).
Number of enterprises and salaried employed personnel and respective
rates, by type of demographic event - Brazil - 2008-2018
| Year | Types of demographic events | |||||||
|---|---|---|---|---|---|---|---|---|
| Active enterprises | Exits | Balances (Entries - Exits) |
||||||
| Total | Survivors | Entries | ||||||
| Total | Rates (%) | Total | Rates (%) | Total | Rates (%) | |||
| Number of enterprises | ||||||||
| 2008 | 4,077,662 | 3,188,176 | 78.2 | 889,486 | 21.8 | 719,915 | 17.7 | 169,571 |
| 2009 | 4,268,930 | 3,322,254 | 77.8 | 946,676 | 22.2 | 755,154 | 17.7 | 191,522 |
| 2010 | 4,530,583 | 3,531,460 | 77.9 | 999,123 | 22.1 | 736,428 | 16.3 | 262,695 |
| 2011 | 4,538,347 | 3,666,543 | 80.8 | 871,804 | 19.2 | 864,035 | 19.0 | 7,769 |
| 2012 | 4,598,919 | 3,738,927 | 81.3 | 859,992 | 18.7 | 799,419 | 17.4 | 60,573 |
| 2013 | 4,775,098 | 3,903,435 | 81.7 | 871,663 | 18.3 | 695,748 | 14.6 | 175,915 |
| 2014 | 4,557,411 | 3,831,140 | 84.1 | 726,271 | 15.9 | 943,958 | 20.7 | -217,687 |
| 2015 | 4,552,431 | 3,843,787 | 84.4 | 708,644 | 15.6 | 713,628 | 15.7 | -4,984 |
| 2016 | 4,481,596 | 3,833,122 | 85.5 | 648,474 | 14.5 | 719,551 | 16.1 | -71,077 |
| 2017 | 4,458,678 | 3,782,234 | 84.8 | 676,444 | 15.2 | 699,376 | 15.7 | -22,932 |
| 2018 | 4,392,871 | 3,695,792 | 84.1 | 697,079 | 15.9 | 762,940 | 17.4 | -65,861 |
| Salaried employed personnel | ||||||||
| 2008 | 26,978,086 | 26,160,232 | 97.0 | 817,854 | 3.0 | 414,908 | 1.5 | 402,946 |
| 2009 | 28,238,708 | 27,373,575 | 96.9 | 865,133 | 3.1 | 452,208 | 1.6 | 412,925 |
| 2010 | 30,821,123 | 29,797,370 | 96.7 | 1,023,753 | 3.3 | 363,848 | 1.2 | 659,905 |
| 2011 | 32,706,200 | 31,726,069 | 97.0 | 980,131 | 3.0 | 410,407 | 1.3 | 569,724 |
| 2012 | 33,915,323 | 32,964,847 | 97.2 | 950,476 | 2.8 | 453,082 | 1.3 | 497,394 |
| 2013 | 35,050,524 | 34,162,830 | 97.5 | 887,694 | 2.5 | 524,159 | 1.5 | 363,535 |
| 2014 | 35,220,894 | 34,373,780 | 97.6 | 847,114 | 2.4 | 525,652 | 1.5 | 321,462 |
| 2015 | 33,623,393 | 32,845,567 | 97.7 | 777,826 | 2.3 | 492,182 | 1.5 | 285,644 |
| 2016 | 32,011,930 | 31,272,598 | 97.7 | 739,332 | 2.3 | 507,051 | 1.6 | 232,281 |
| 2017 | 31,877,046 | 31,047,640 | 97.4 | 829,406 | 2.6 | 469,406 | 1.5 | 360,000 |
| 2018 | 32,296,827 | 31,433,572 | 97.3 | 863,255 | 2.7 | 512,113 | 1.6 | 351,142 |
| Source: IBGE, Diretoria de Pesquisas, Coordenação de Cadastro e Classificações, Cadastro Central de Empresas 2005-2018, Note: Due to potential changes in the scope of the enterprises from one year to the other, the computation of the number of active enterprises (or salaried employed personnel) in year t not necessarily equals to the number of active enterprises (or salaried employed personnel) in t-1 plus entries in t less exits in t. Please see the Technical Note for more information. |
||||||||
The study also assessed the survival of enterprises in the 5-year period. Enterprises born in 2013 were followed up and the survival rate stayed at 71.9% after 1 year of operation (2014), 61.0% after 2 years (2015), 51.5% after 3 years (2016), 44.1% after 4 years (2017) and 36.3% after 5 years (2018).
The larger the size of the enterprise, the higher was the survival rate. In the first year of observation (2014), the survival rate was 64.5% in the companies without personnel; 91.2% in those with 1 to 9 salaried persons and 96.1% in those with 10 or more employees. After 5 years, the rates changed to 29.9%, 52.7% and 62.5%, respectively.
Central-West recorded the highest opening rate of local units and the North, the highest exit rate
Among the active local units, 50.0% were located in the Southeast; 22.6%, in the South; 15.3%, in the Northeast; 8.3%, in the Central-West; and 3.7%, in the North. In the North, Northeast and Central-West regions, the entry and exit rates were higher than the national average. The entry rate in the Central-West (17.7%) and the exit rate in the North (19.6%) stood out.
Concerning the Federation Units, the highest entry rates were recorded in Amazonas (22.1%), Maranhão (20.5%) and Amapá (20.4%). Conversely, Rio Grande do Sul (13.3%), Santa Catarina (14.1%) and Minas Gerais (14.9%) posted the lowest rates.
The highest exit rates were registered in Amazonas (21.6%), Pará (20.8%) and the Federal District (20.7%). The lowest exit rates were in Santa Catarina (13.4%), Rio Grande do Sul (15.5%), Paraná (15.9%) and Piauí (15.9%). The highest survival rates also occurred in the South: 86.7% for Rio Grande do Sul, 85.9% for Santa Catarina and 84.6% for Paraná.
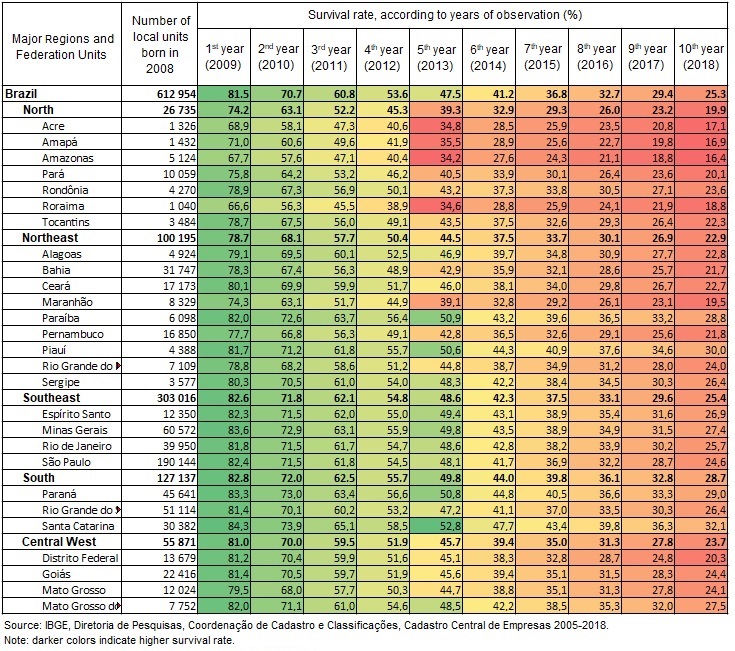
The study also assessed the survival rate of the local unit born in 2008, according to the Federation Units. Only nearly 25.3% survived 10 years after and only 47.5%, five years after their birth. The Federation Units registered a significant difference, with the survival rates in the fifth year of life varying from 34.2% in Amazonas to 52.8% in Santa Catarina. The Northeast registered the biggest gap: 50.9% in Paraíba against 39.1% in Maranhão. In the Southeast, São Paulo (48.1%) recorded the lowest rate and Minas Gerais (49.8%), the highest one.
Surviving companies created 8.9% of the new local units and more than one third of the new jobs.
The local units are the addresses where the enterprises operate and can have one or more units. The study measured the number of local units from companies that already existed in the market since the previous year in relation to the total entrant local units in 2018. Such companies accounted for 69.0 thousand of the 775.1 thousand entrant local units in 2018, resulting in a participation of 8.9%. Only these units accounted for 34.3% of the total salaried personnel of entrant local units.
In addition, the entrant local units coming from the expansion of existing enterprises paid an average monthly salary 35.4% higher, i.e., R$2,710.95 against R$2,001.77 of the total entrant local units. Also, the units originated from the expansion of existing companies already started their operations with nearly four times the average number of employees (6.5 versus 1.7 salaried persons per local unit).
Entrepreneurship: 1.0% of the enterprises with employees are high-growth ones
In 2018, Brazil counted with 22,732 high-growth enterprises (at least 20% of average growth of the salaried employed personnel per year for a period of three years and with 10 or more salaried employed persons in the first year of observation). This figure rose in relation to 2017, when it hit the lowest level in the time series, though it is still in the third lowest level, quite below the peak in 2012 (35,206).
In 2018, these companies employed 2.9 million salaried persons and paid R$85.5 billion in salaries and other compensation, with an average monthly salary of 2.7 minimum wages. At the level of the enterprises with 10 or more employees, they absorbed 11.2$ of the workforce and produced 9.1% of the salaries and other compensation.
Among the active enterprises with salaried employed personnel, only 1.0% are of high growth. However, these companies accounted for 9.1% of the salaried personnel. In 2018, they employed 2.9 million salaried persons and paid R$85.5 billion in salaries and other compensation, with an average monthly salary of 2.7 minimum wages.
Only 5.6% of the high-growth enterprises keep the pace 5 years later
The results of the study suggested how hard it was to sustain a quick growth. Considering the companies that became high-growth enterprises between 2008 and 2013, only 5.6% of them repeated the phenomenon after five years, even recording a high survival rate in this period. Such recurrence decreased over the years, reaching 3.1% after 10 years of observation, for those born in 2008.
High-growth enterprises had, on average, more years of market (14.3 years) than the whole set of active enterprises (11.6 years), though they were still younger than the average of those with 10 or more salaried persons (16.3 years).
Concerning the size, high-growth enterprises could not be considered small companies. In 2018, they had, on average, 129.1 salaried persons against a total of 57.4 reported in those companies with 10 or more salaried employed persons.
Between 2015 and 2018, high-growth enterprises generated 1.8 million jobs.
Although high-growth enterprises represented only 0.5% of the Brazilian active enterprises, they performed a relevant role in the corporate structure, particularly in the generation of formal jobs. Between 2015 and 2018, the companies with salaried persons generated 2.5 million formal jobs. In the same period, high-growth enterprises contributed with 1.8 million (or 72.0%) of those new jobs.
Although they were present in all the economic activities, the penetration rate of high-growth enterprises was not homogeneous. The relative participation of companies with at least 10 salaried persons was higher in Administrative activities and complementary services (9.2%), Information and communication (8.5%) and Construction (7.6%).
Among the 10 largest sectors, the three smallest participation were: Housing and food (2.7%); Education (3.5%), posting an important relative drop in the last years; and Trade; repair of motor vehicles and motorcycles (3.8%), showing that although this activity concentrated the biggest number of high-growth enterprises (25.1%) in relation to the total entities in this sector, high-growth enterprises were proportionally less present.
11.4% of high-growth enterprises were gazelles
In 2018, Brazil counted with 2,597 gazelle enterprises – high-growth enterprises with up to five year of age –, which absorbed 198.8 thousand salaried persons and represented 11.4% of the total number of high-growth enterprises.
Between 2013 and 2018, both the number of gazelle enterprises and the salaried employed personnel registered consecutive drops. The contingent, which had been 4.7 thousand companies in 2012, changed to 2.4 thousand companies in 2017, and the total number of employees, from 424.0 thousand to 198.8 thousand in this period. In 2018, the contingent of gazelle enterprises increased 7.2% over the previous year.

